But when I backtested against one sample stock [ ADANIPORTS ] - it is giving me erroneous data -
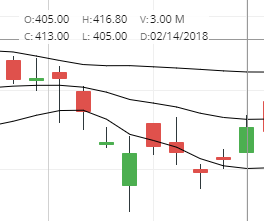
See the candle on 14th FEB - 2018. O=L is correct but the other condition is not fulfilling.
OPEN price is above the LBB (20,1)
Another similar example: IDBI BANK - CHECK 13-APR-2018 DATA
Also if you check the DAY candle on 02-APR-2018. it should have appeared in the scanner. But it never appeared.
Please help !!
The problem is occuring not due to erroneous data but due to the following reasons :
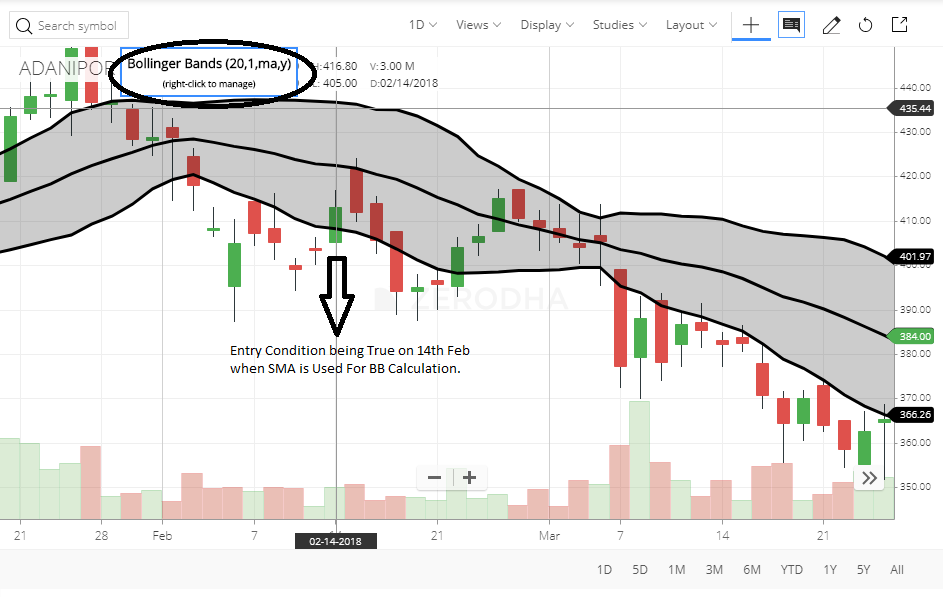
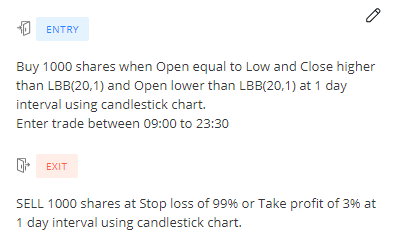
Reason for Buy (Entry) signal on 14th Feb 2018:
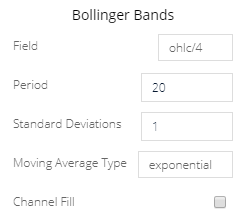
You have used Exponential Moving Average for calculating Bollinger Bands when the signals are being verified through charting. Kindly change ‘Moving Average Type’ to Simple because by default, Bollinger Bands use Simple Moving Average as that’s what we support currently. After this change, you should see a buy condition being formed on charts.
Reason for no Buy (Entry) signal on 2nd April 2018:
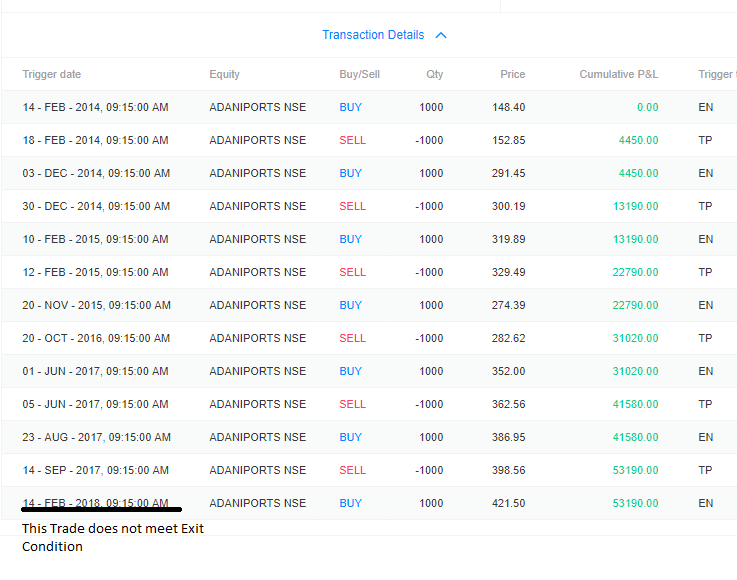
If you run the backtest and observe the trade log (Click on ‘Transaction Details’ on the backtest results page), you can observe that the last trade on 14th Feb 2018 was a Buy trade (because the Entry condition was true as explained in point no. 1). After this buy trade, if you observe the chart, non of the exit conditions, i.e 99% Stoploss OR 3% Take Profit were true hence no Sell signal occured after that. And since this last buy trade which was taken on 14th Feb 2018 never got closed, the buy condition on 2nd April did not generate another buy (Entry) signal.
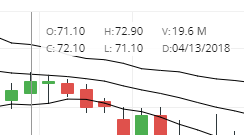 IDBI BANK - CHECK 13-APR-2018 DATA