Hi, @nithin and @siva
I found the discrepancy b/w Hourly and Daily chart of Bajaj-auto.
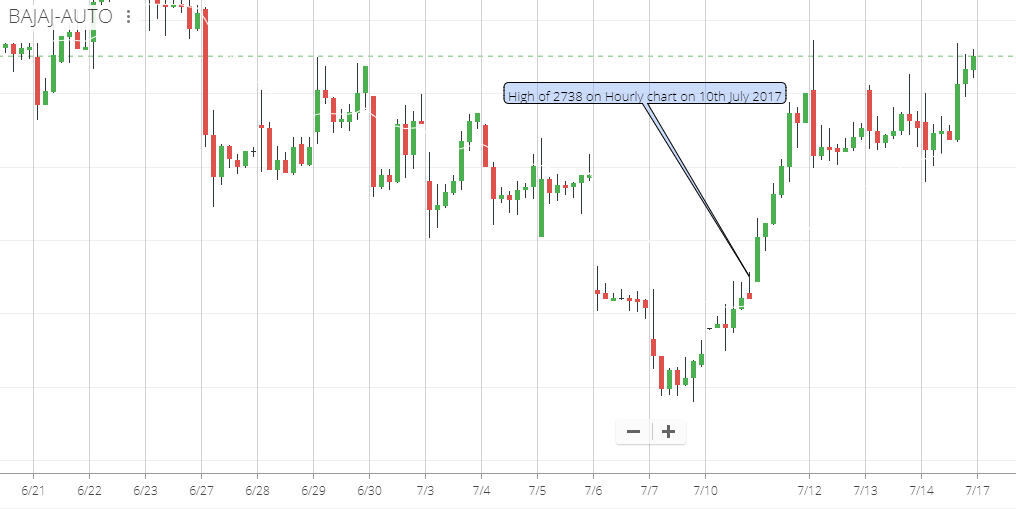
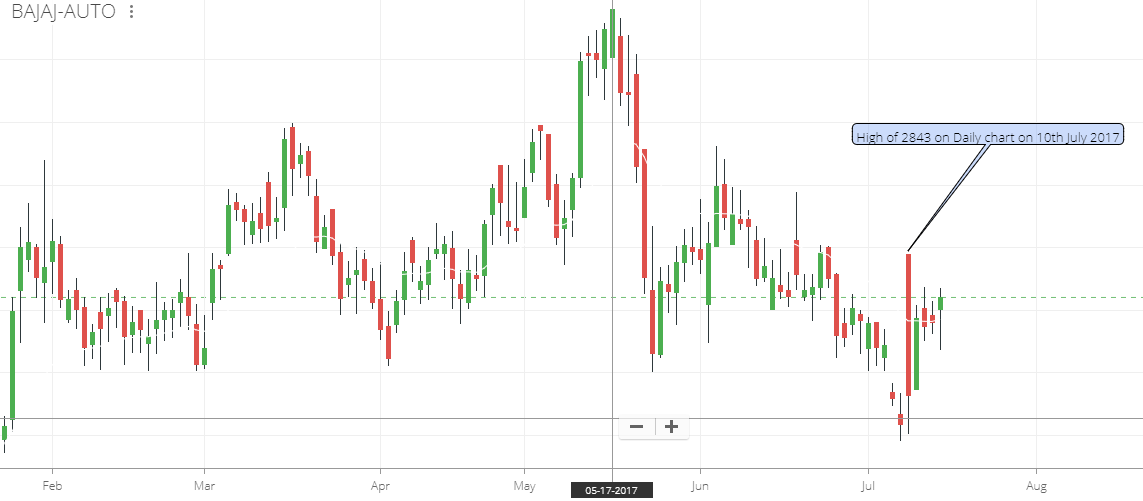
While high in hourly chart shows 2738, daily shows 2843. Difference of almost of 100 points.
Should we really rely on this resource? This will only mislead us to take wrong position. This is catastrophic!
10/7/2017 was a day when nse shutdown down for more then 3 hours
on 10/7/2017 there was two opening session in nse, first on 9.00 oclock(regular)
and second one was at 12.00 oclock .
the high you are saw at hourly chart is made after 12 oclock when trading is restart after technical glitch.
but at daily chart you saw high of pre open market at 9.00 oclock.
my advice is avoid 10/7/2017 data for all stocksin your analysis.
NSE had a pre-open session at 9am and 11.15am but the markets were stopped due to a feed issue. The markets then finally started at 12.15am. The price of 2843 could’ve been a stray tick traded when the markets started after one of the first two pre-open sessions and then stopped due to a market depth issue.
Also, at the end of the day, there will be a difference between the OHLC value of minute/hourly candles as compared to OHLC value of daily candles. Read this post for more info:
Ya, as answered above that is the day NSE has glitch, there is broadcast issue on that day, we have synced daily candle data with bhavcopy of NSE and hence the difference with intraday candles.
Also if you observe there is considerable difference in daily OHLC values for any stock on BSE to NSE on july 10th.