There are a lot of reports published by exchanges on their website after close of a trading day.
How do we optimally use these reports in preparing ourselves for trading the next day.
Does anyone have a trading model based on these reports?
Would be great if you cane share any material or weblink which guides how to use these reports.
1 Like
Check delivery percentage. Also orders volume
Day high day low.
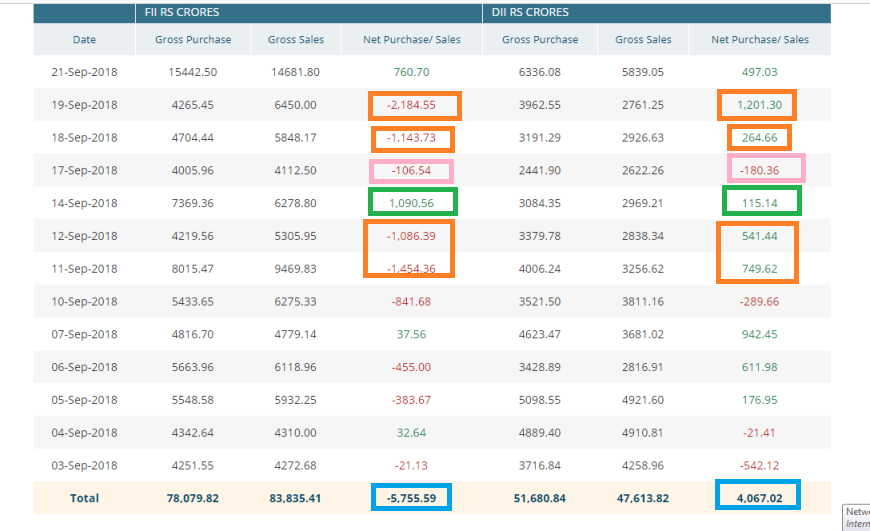
EOD reports published by exchanges are very useful for next trading day . for example i use FII / DII daily trading activities and also by monthly wise , to assess conditions of the market , since FII & DII’s are main drivers of the stock market .for example , if you check FII /DII trading activities on 14 sep 2018 , both FII/ DII buy , net purchase was in positive , and stock market bounced back 145 points ,
web links are
https://www.nseindia.com/products/content/equities/equities/fii_dii_market_today.htm
1 Like
How can I use delivery percentage to draw any conclusion?
High delivery perc is always a plus for a stock… Operator manipulated stocks or pure intraday may spike volumes but such stocks show that just price movement advantage is being exploited by traders
This video goes over the key aspects of analyzing deliverable quantity:
? [ Its Importance]")
1 Like
ok ![]()
but how will you use it ? paper trade ? ![]()
HI TimeFrame,
i am new to trading & zerodha & this is my first reply to any question. till now i was just reading answers from expert traders like you.
i have 1 doubt, you mentioned that on 14 Sep , FII/DII ratio was positive & market bounced back by 145 points.
So i googled the nifty index for last 1 month & i noticed that after 14-Sep market declined.
here is the image/link
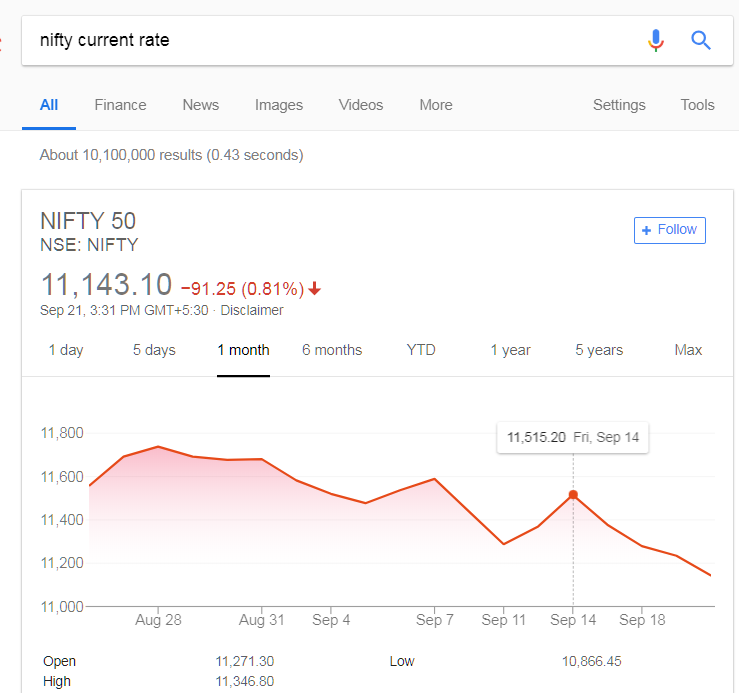
am i looking in right direction or i missed something here ?
Thanks good information.
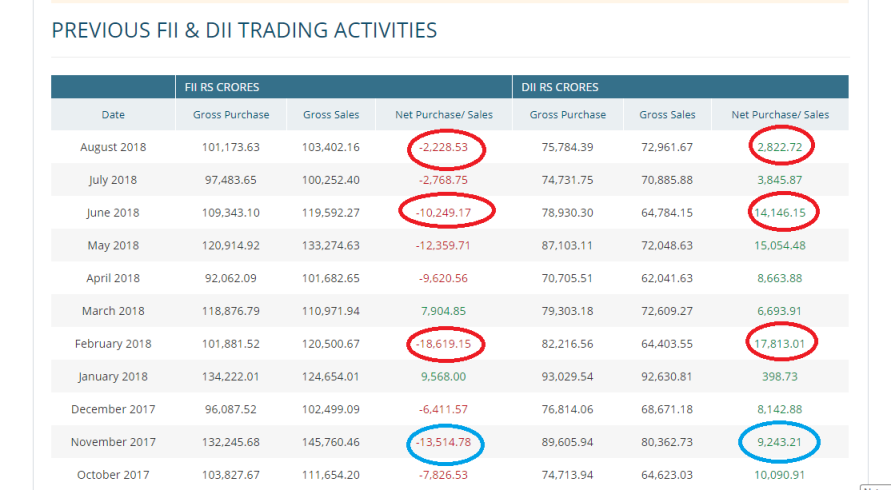
Well you are right , i didn’t explained it elaborately , i use both daily and monthly trading activities of FII /DII , on 14 Sept both FII/DII buying was in positive ,but on 17 Sept both FII/DII buying was negative . and for the September month FII’s sold more than DII’s , plus DII’s are also started selling . If you check previous months details , DII’s purchased more than FII’s , manged to balance the FII selling and their purchase made market to move higher.
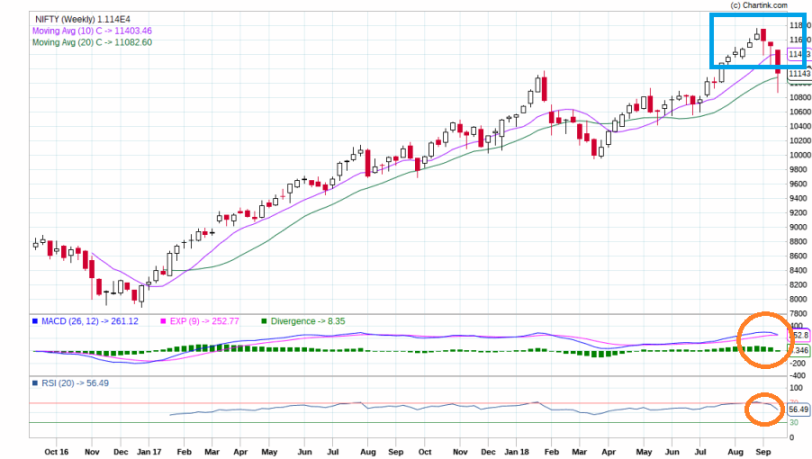
I use technical charts also , market closed below important moving averages , MACD & RSI moving in to negative territory , and both the studies indicating down trend for the market.
Thanks.
understood little but i need to understand more about FII & DII & its impact on market trend.
1 Like
Well , in my experience monthly wise FII/DII activity is more useful than daily , since daily activity is after FII/ DII trade action.