The month of February 2018 was a very interesting month to trade options. This was the kind of month which favored traders with knowledge of Option Greeks. Here is the background data for you –
Date - 6th February 2018
Nifty Spot - 10498
Option - 9500 PE
Option Premium - Rs.20.35/-
Number of trading days to expiry - 9
Consider this, the 9500 Put option, which was 1000 points away was trading at a premium of Rs.20.35/- or in other words, there were few market participants, who were willing to pay a premium as high as 20.35, for this option. The buyers of these Put option would be profitable only if the market fell 10% in a matter of 9 days.
The question to ask – what was the probability of Nifty falling 10% in a matter of 9 days.
Well, as you can imagine, the probability of this event occurring was low. Fair enough, but given the low probability, why was the premium so high for this option? Was there something else which is driving the price of these options apart from the option buyer’s irrational expectations?
The answer to these questions lies in the following graph –
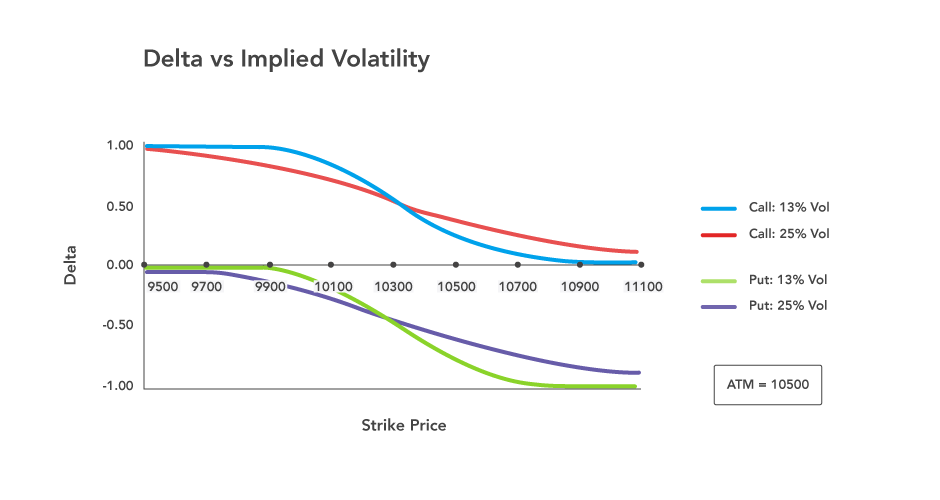
This graph represents the movement of Delta with respect to strike price and volatility. Here is what you need to know about the graph above –
-
The blue line represents the movement of the delta of a call option, when the implied volatility is 13%
-
The red line represents the movement of the delta of a call option, when the implied volatility is 25%
-
The green line represents the movement of the delta of a Put option, when the implied volatility is 13%
-
The purple line represents the movement of the delta of a Put option, when the implied volatility is 25%%
-
The call option Delta varies from 0 to 1 and the Put option Delta varies from 0 to -1
-
Nifty is at 10498, hence 10500 becomes the ATM strike
With the above points in mind, let us now understand how these deltas behave –
-
Starting from left – observe the blue line (CE delta when IV is 13%), considering 10500 is the ATM option, strikes such as 9500, 9700 etc are all Deep ITM. Clearly Deep ITM options have a delta of 1
-
When IV is low (13%), the delta flattens at the ends (deep OTM and ITM options). This implies that the rate at which Delta moves (further implying the rate at which the option premium moves) is low. In other words deep ITM options tends to behave exactly like a futures contract when volatility is low.
-
You can observe similar behavior for Put option with low volatility (observe the green line)
-
Look at the red line (delta of CE when volatility is 25%) – we can notice that the end (deep ITM/OTM) is not flattened, in fact, the line appears to be more reactive to underlying price movement. Or in other words, when the volatility is high, the deep OTM and ITM options tend to display faster delta changes
-
A similar observation can be made for the Put options when volatility is high (purple line)
-
Interestingly when the volatility is low (look at the blue and green line) the delta of OTM options goes to almost zero. However when the volatility is high, the delta of OTM never really goes to zero and it maintains a small non zero value.
Now, going back to the initial question – why was the 9500 PE, which was 1000 points away, trading at Rs.20.3/-?
Well, that’s because 9500 PE was a deep OTM option, and as the delta graph above suggests, when the volatility is high, deep OTM options have non zero delta value. In fact, the volatility of Nifty had shot up to 24%, as opposed an average value of 13-15%.
Given the high volatility, Delta does not really collapse to zero (like the blue/green line). This should explain why the deep OTM option commanded a premium.
Further, add to this the fact that there was some time value, the OTM option tends to have a ‘respectable’ premium, much to the option writers delight.