Please provide an explanation with the formulae for Pivot points used in Kite and Pi. Also provide an example of how Pivot points show on Kite and Pi.
Hello,
There are different ways to calculate pivot points, Kite and Pi uses slightly different ways and hence may not match.
The input for pivot point is High, Low, and Close (HLC) of previous candle.
On pi the previous candle is hard coded to day candle. So whatever chart time frame (1min,15mins, 30mins, 1hour, 4hours) the pivot points are calculated based on yesterday’s High, low and close.
In Kite it is dynamic,
Previous day candle HLC values are considered for 1,3,5,10,15 min timeframe.
Previous week candle HLC values are considered for 30 min and 1 hour.
Previous month candle HLC values are considered for 1 day timeframe.
Hence the pivot points may not match when looking at a 30min, 1 hour, or 1 day time frame.
Also, the way S3 or R3 is calculated is slightly different on Kite and Pi. See the formula below.
Pivot Points formula on Kite:
Pivot point § = (H + L + C) / 3
First support level (S1) = (2 * P) – H
Second support level (S2) = P – (H – L)
Third support level (S3) = P – 2*(H-L)
First resistance level (R1) = (2 * P) – L
Second resistance level (R2) = P + (H – L)
Third resistance level (R3) = P + 2*(H – L)
Pivot Points formula on Pi:
Pivot point § = (H + L + C) / 3
First support level (S1) = (2 * P) – H
Second support level (S2) = P – (H – L)
Third support level (S3) = Low – 2(High – PP)
First resistance level (R1) = (2 * P) – L
Second resistance level (R2) = P + (H – L)
Third resistance level (R3) = High + 2(PP – Low)
Note: S3/R3 values are calculated differently for Kite and Pi.
There are different ways to calculate pivot points (so both ways are correct), both kite and pi is powered by different charting engines and hence they differ. .
5 Likes
Something is off. I am looking at Infy 5 min stock chart. The OHLC for Thursday 6th july is 945, 957, 947, 944.2 (I am checking this on the daily candles/market depth). Using this data pivot point is (H+L+C)/3 = 949.45. But pivot point on the Kite chart is showing 949.35 for 7th July. Can you explain why this difference?
1 Like
When you open the 5 min chart, the charting engine will have only 5 min data points historically. It won’t have 1 day data points. What this means is that to find the previous day OHLC, the 5 min chart will look at all the candles in the previous day and then take these points.
The previous day OHLC taken from a 5 min chart can be different from OHLC from a daily candle. Hence the pivot point may not match the way you are calculating. I have explained this here. Make sure to read all the links I have shared as well.
So if you are looking at 5 min Infy chart, the OHLC is taken from the places I have tick marked
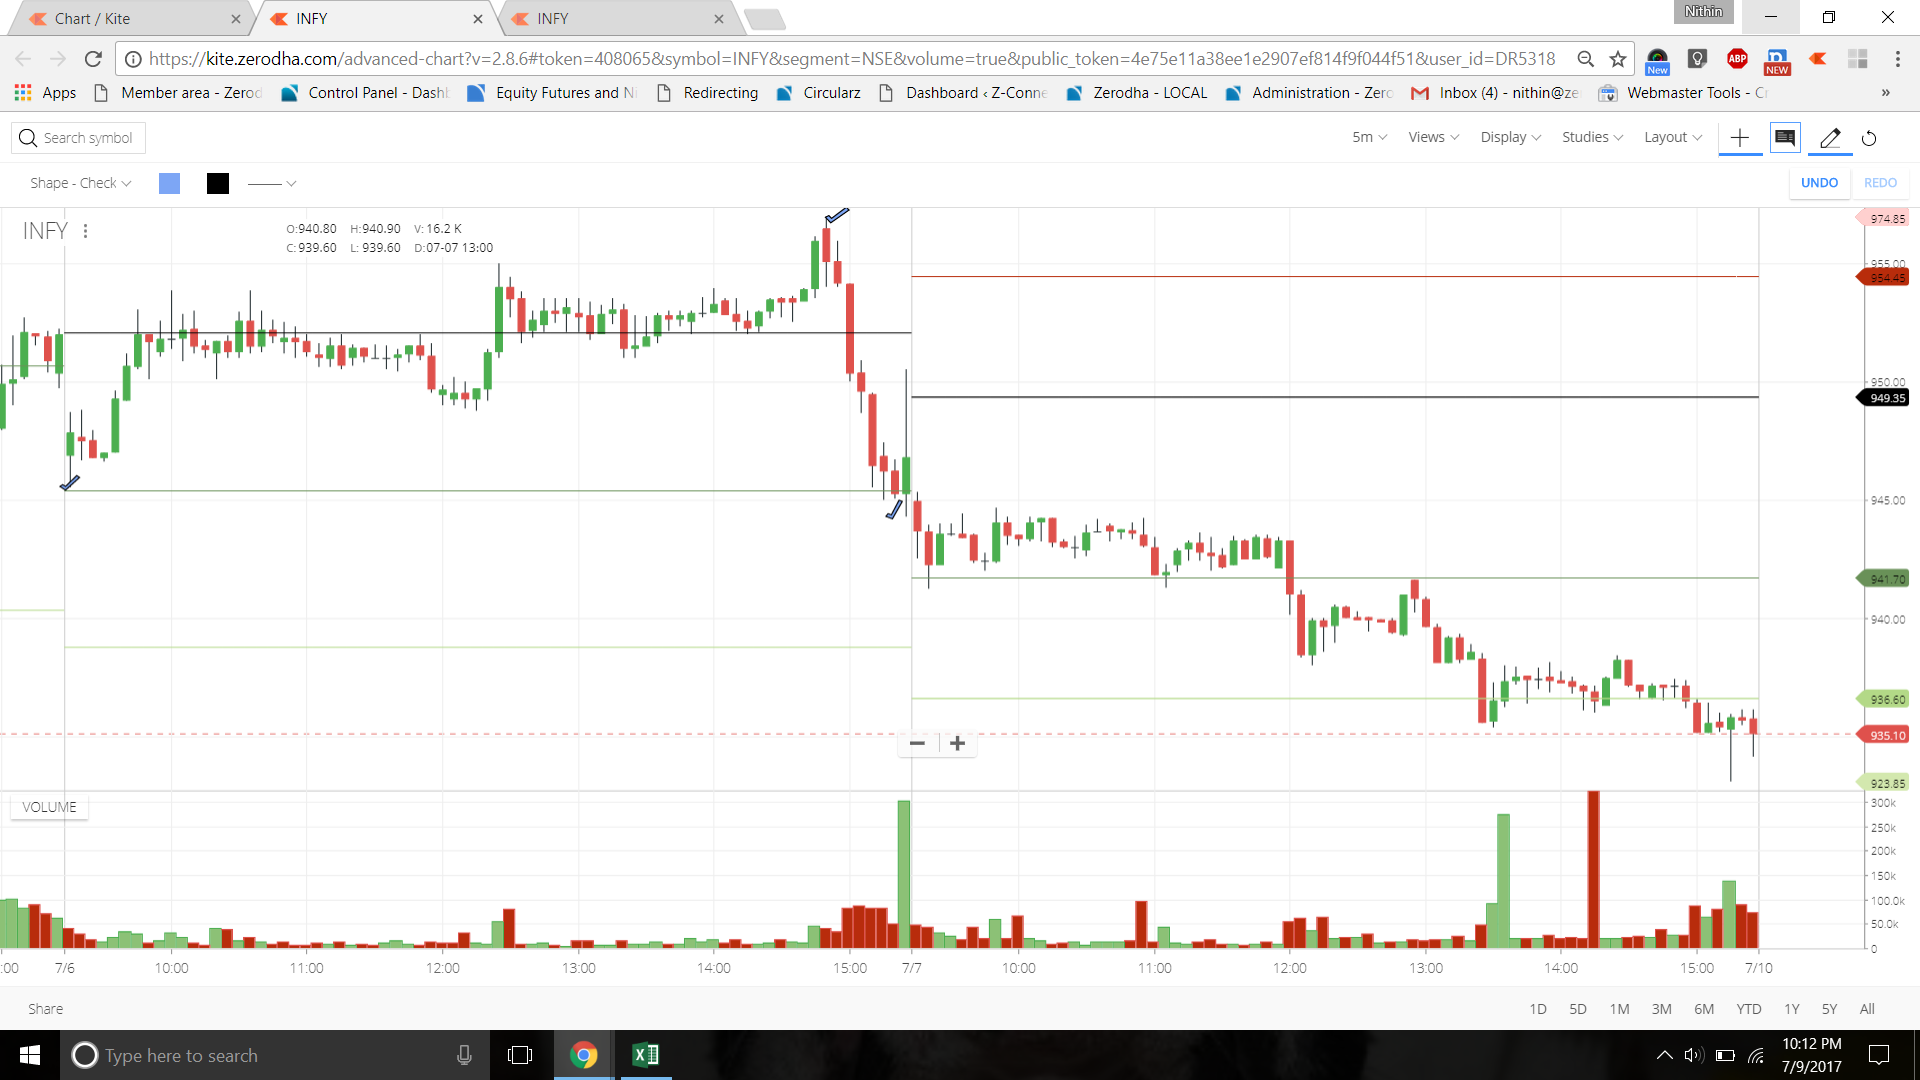
So OHLC is 946.85, 957, 944.25, 946.8. Pivot point = (H+L+C)/3 = 949.35, which matches what is on the chart.
6 Likes
What is the name of the study in PI for Pivot points please ? I don’t find any chart called Pivot in PI ?
to add pivot pointson PI u can open the stock in chart and right click on the chart, u can find pivot points.
Nitin Sir,
Can you provide some option to draw lines at PDH, PDL and PDC also Previous Week High, Low and Close. Both in Pi and Kite Please.
This can be done as the Pivot Lines are provided in Pi and Kite.
Thanks.
Not possible for now but will note this.
its not what zerodha uses… I tried but it does not matches zerodha’s pivot points…
What is the exact formula for pivot points showing in kite chart? Thank you in advance
the H L C are marked, a line should have been drawn to know the exact figure. I am pointing this out because i am using 5 min chart and in no way the pivot points by calculation using the H L C of the previous day candles (5 min chart) are in sync with the pivot points of the following day . Why is there this difference, Kindly sort it out … Kite is trustworthy and it should not earn a bad name because of this
how can the OHLC be different for a particular day with the change of time frame . Do u mean to say that Kite creates its own OHLC as per its convenience??? i Belief the OHLC of any stock for a particular day remains constant irrespective of the trading platform or time frame. Whats the logic of changing OHLC with time frame change
You have mentioned up to 4 hours for pi but What pi calculates for 1 Week, 1 Month calculation.
Also I loaded weekly and monthly chart on PI but pivot points does not appear, is that a technical problem with my system or it is normal.
It is normal, Pi wont display for more than day timeframes.
Many thanks for clarification
Pivot Point for 5 minute chart on KITE is based on previous day Open, High, Low, Close.
But I would like to know which OHLC are considered by KITE for Pivot Points displayed on Weekly Chart.
Thanks in advance for your reply
To arrive at weekly and monthly, year points are considered.
Have checked on so many stocks but pivot point on weekly and monthly charts are different (e.g. ICICIBANK), please can you check again for how does pivot points shown on weekly charts are calculated ?
You are right that for monthly pivot point previous year points are considered.
Thank you in advance
hi,
It will be a great help if you can answer above question .