I understand that I can put a drawing on Chart for this purpose manually, but it would be easier to have the displayed automatically on Chart to make trading decisions quickly on chart
I THINK YOU CAN DIRECTLY BUY/SELL WHILE WATCHING CHARTS BUT U CANT’T SEE YOUR HOLDINGS OR POSITIONS PRICE ON CHARTS. YOU CAN PUT LONG OR SHORT POSTION FEATURE ON CHART TO TRACK YOUR PROFIT&LOSS.
What is “YOU CAN PUT LONG OR SHORT POSTION FEATURE ON CHART”? How do i do this?
I suppose he is asking about Kite, not TradingView. I have just got Zerodha Account. Will probably have lot of questions soon  I would like to know answer to @ChinniKrishna’s question.
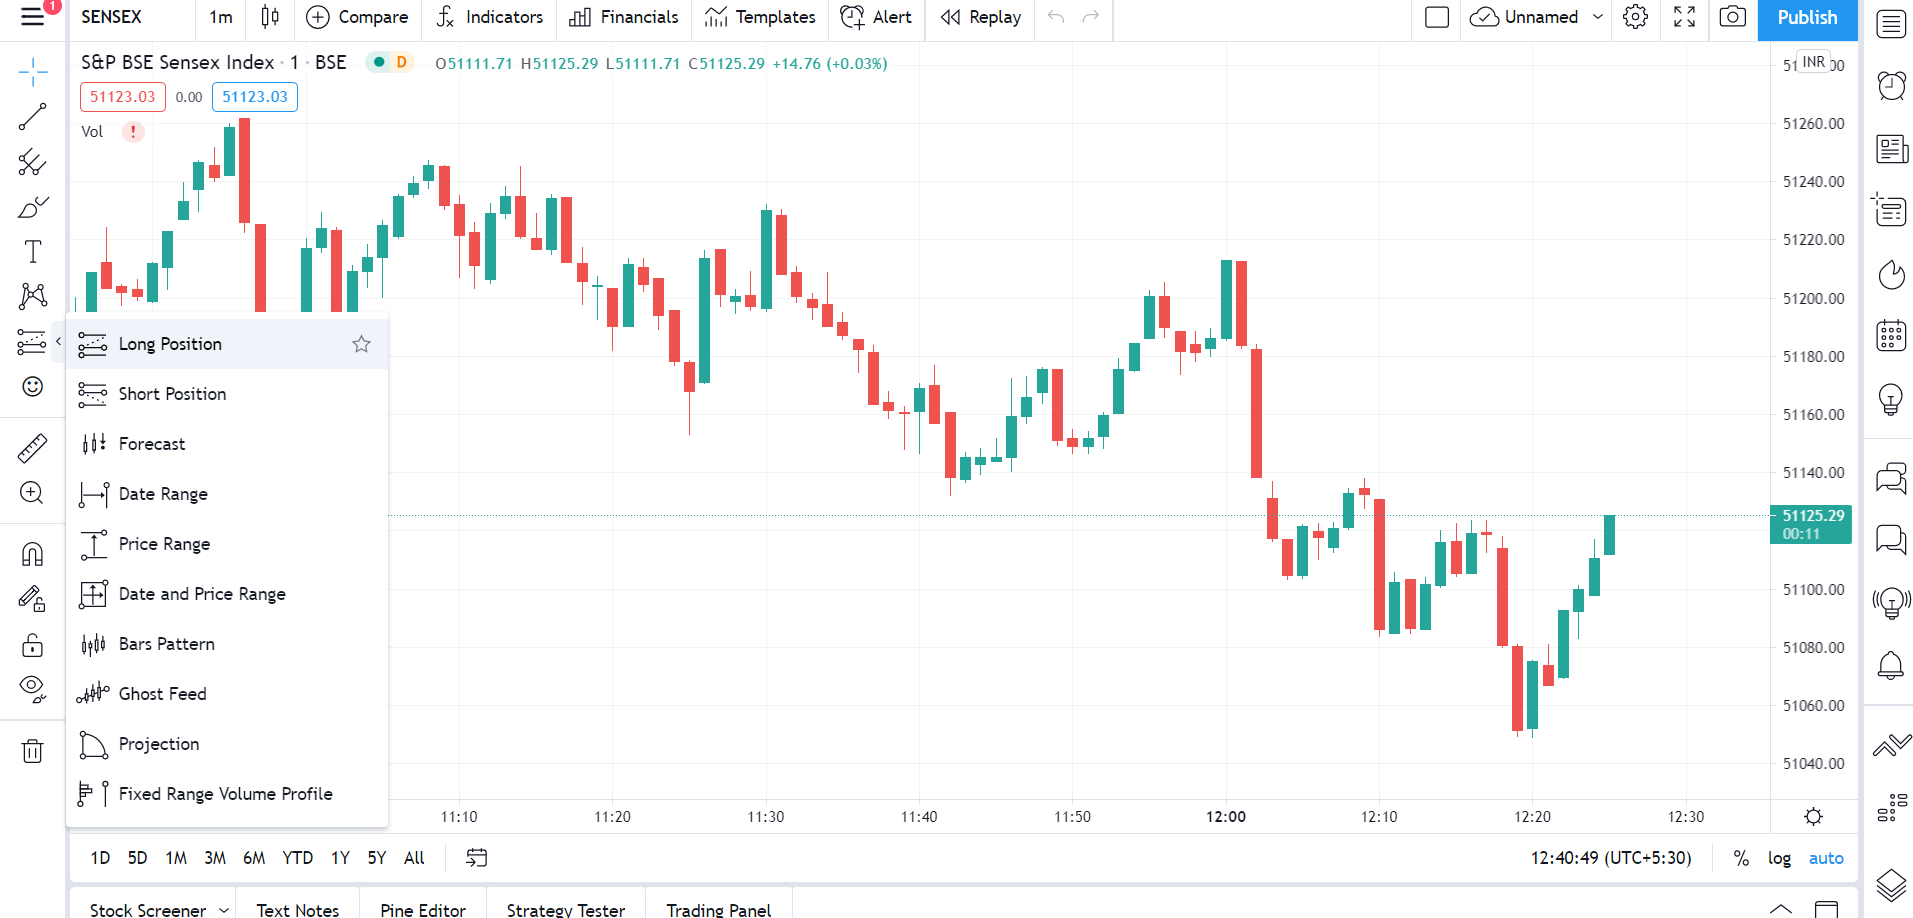
ACTUALLY THIS FEATURE IS SAME IN KITE CHARTS. I GAVE THE SCREENSHOT OF TRADINGVIEW JUST BEACUSE I DON’T WANT TO DISCLOSE MY CLIENT ID.
1 Like
Thanks for the screenshot Ranjan.
Yes, I’m asking for automatic marking of holding/position average price on Kite Charts. As of today, we can see a mark of open order or can enable event of open order. Similar to it, I’m looking for a mark for average price.
My current workaround is to simply draw a horizontal line at the price of holding But this is manual. Also for intra-day trades, the average keeps changing as i keep buying and selling and i have to always switch to Positions page to check that.