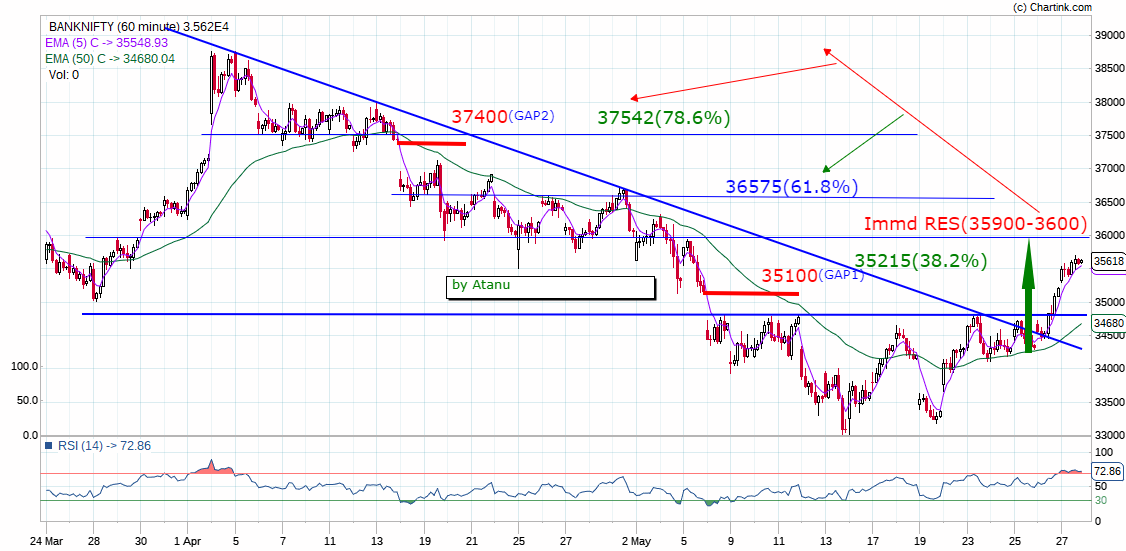
Banknifty hourly chart on the basis of trend & price actions…
1 Like
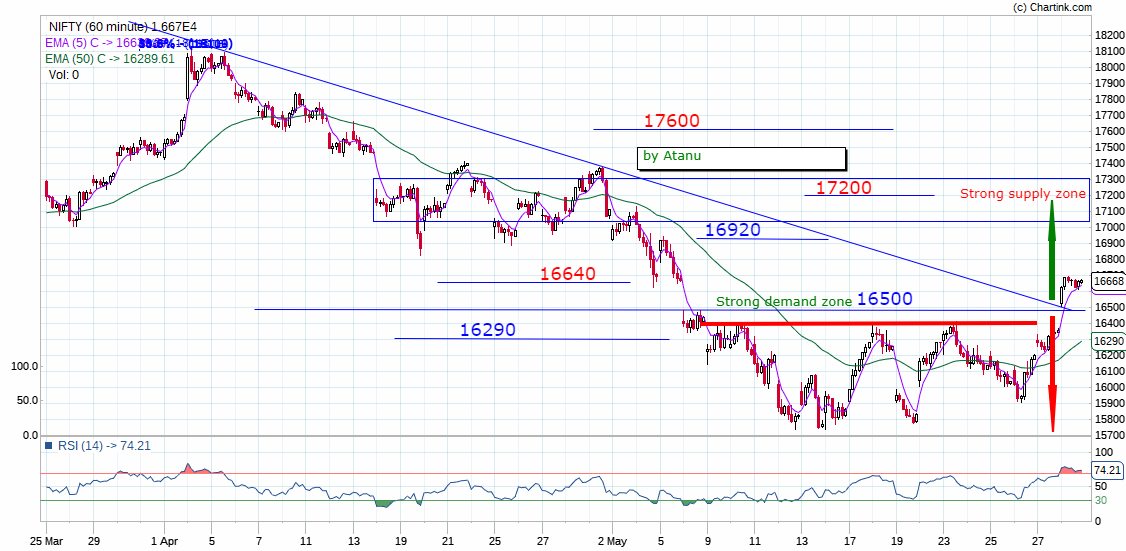
For nifty:
16700 is strong resistance.
If tomorrow opens flat, good to short with SL 16730-16750
Just my personal view and not a tip
This chart is nice. as we can see 36000-36575 is the real monster bear zone. If market somehow navigates through this zone, we can more or less confirm short term bottom in bank nifty.
spot on. 16750-830 looks like a proper short zone for me.
With russian oil embargo by EU, crude is now above 120$ per barrel …which may put some pressure to rupee and eventually mrkts.
2 Likes
yes ofcourse bro…
Banknifty exactly showing strong supply area as given on the chart and given fall of around 800 points quick ![]()
Hey guys can you really make money by drawing some lines? Or is it just a satisfaction that the lines are simply straight enough.
lines are only drawn so that we can prepare ourselves before making any decision in particular component in a specified level…no line can fetch any yield without taking any action. All students prepare notes while studying any subject, is it guaranteed that he/she will pass the exam with flying colours…on the fear of fail shouldn’t we prepare notes?
3 Likes
My question was are lines practical enough to make money?
I listened to a podcast from a veteran trader, who spurted something like, if you think drawing some straight lines on the chart ll make you money in the longer run, then you are in for a big disappointment! Same he said about relying on many indicators which ultimately make the chart look like a sketch book.
I dropped out indicators,then I can see things more clearly.
I just wanted an opinion about people who draw lines on the chart. Is that practical?
Charts, lines and technical analysis are all tools of probability. Helps us with better risk and reward management.
For some, trendlines work like magic, for some moving avgs, for some just a plain chart…to each their own.
2 Likes
all charts are practical…everyone has his/her own method of reading data. Someone depend on lines/bars, someone on OI, someone on indicators, someone on news or events, someone on only self intuition and someone on only luck and hopes…in stock market nothing is fixed so that anyone must apply or stick to that particular thing to earn. One must adopt that only whichever suits him to earn money. ![]()
Weekly expiry overview for tomorrow
Today NIFTY and BANKNIFTY took supports exactly at demand zones given on earlier charts of NIFTY & BANKNIFTY…around 16400 & 35200 respectively. Observing today’s OI data, it’s seen that there is huge writing of CALLS & unwinding of PUTS seen ahead of weekly expiry. Drama will be same that market makers won’t allow to breach 16700 on upside and 16350 on downside in a normal condition tomorrow. The only mantra for tomorrow will be to buy the dips if gets around today’s low with sl near 16350 in spot and sell the rally above 16650 or trades and sustains below 16500 in spot. From the data, it’s believed that retailers bought calls and written puts hugely in BANKNIFTY today ![]()
Avoid doing adventures in buying OTM tomorrow on hopes of doing wonders if there will be no news. ![]()
Sgx now down. But too early to say.depends where SPX closes regular trading hours & usual scam of walking the mini’s ES/NQ/YM futures after hours with 1/20 the of NYSE regular trading hour volumes.
Also QT starting from today by the
USA FED…our RBI already mentioned June also 35 to 45 basis points increase. To squash the inflation ( rather stagflation) expectations,they could announce any time interest rates/ discount rate increase.So gap down not impossible.
1 Like
Which podcast was that? I also would like to listen.
Banknifty make or break on Monday.
35100 in spot will be critical support area, if this is broken on gap down it may drift down towards 34900-34800. Again this will be real testing zone for bulls where we see strong demand zone. Below this support we can see free fall of another 200-300 points easily on same day. On upside 35500 will be strong resistance as far as OI additions are concerned…we saw huge amount of call writing from the zone 35500. Overall setup for Banknifty seems to be very very bearish as of now. Now Banknifty may underperform Nifty with high margin.
Just a personal view😇
I appreciate your views, but can you provide something new
whatever you mentioned above can be easily spot on chart & can be curated from OI data
no one will trade befrore doing their homework…so please don’t waste your time on providing this
dude u r not the only person on this platform.
I think u can use this advice to urself. urn’t sharing anything of worth n if someone is trying to do that, u r trying to pull him down…
1 Like