ok bhai, I am small trader having little knowledge only so I’m sharing only what I can provide up to my limited knowledge. If my contents don’t value you then when I forced you to read and follow.
just simply you skip and avoid my insights, thanks!
ok bhai, I am small trader having little knowledge only so I’m sharing only what I can provide up to my limited knowledge. If my contents don’t value you then when I forced you to read and follow.
just simply you skip and avoid my insights, thanks!
ACC made low 2122.2 yesterday, almost hit given range ![]()
did it hurt? ![]()
I’m sorry for being blunt
Man you directly told me to stop wasting time posting silly things…sidhi baat no bakwaas…I didn’t get your (‘new’) thing that you mentioned…that new thing might be also old for someone. Ungli karne se pehle sidhi ye bolna chahiye ki kya karna chahye…I’m not so dump fellow that understand nothing
Take it easy bhai.
Trollers are common on every public platform either avoid them or block them.
Don’t waste so much energy. Let’s focus on important things.
do you really think a troller does that? since this is a public forum I have all rights to present my views before anyone
troller just trolles, but I gave reasons as well
then also if you really think I’m troller then I won’t disturb you again.
![]()
Regarding drawing lines and indicators on charts,
i find that when discussing some ideas, it helps to see annotated charts,
in addition to just the large blocks of text describing the same idea in words.
Agreed. IMO both these observations are bang-on! ![]()
Drawing lines (or curves) on the chart manually or using additional pre-defined indicators is NOT adding any new information. They simply highlight what is already present in the price/volume data. The additional lines/curves/indicators simply emphasize what may not be obvious to one when looking at a plain chart.
Cool. Some other folks might be still further ahead in their journey. They may have been exposed to so many data-points / trends over the years that they can simply look at the price movement over time as a table of numbers and spot the trends/patterns. ![]()
Until we get there, the chart and any indicators are always available for our assistance.
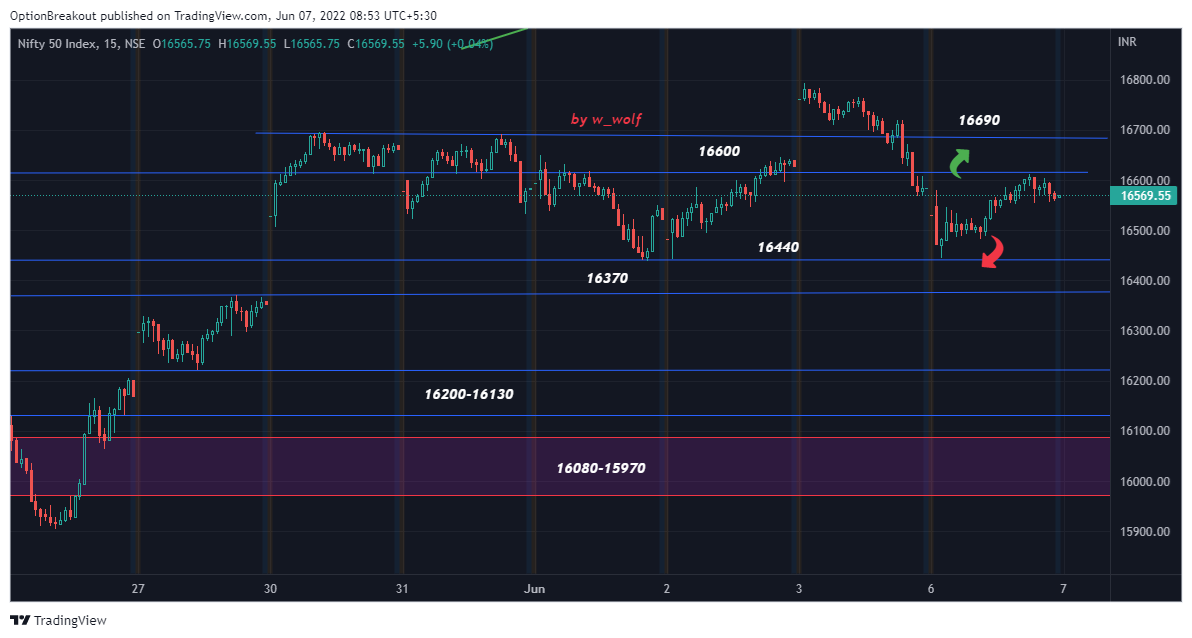
NIFTY 15 mins view
As of now neutral as long as above 16400 and below 16600 in spot levels. Only breaking of those range will show wild move in the day.
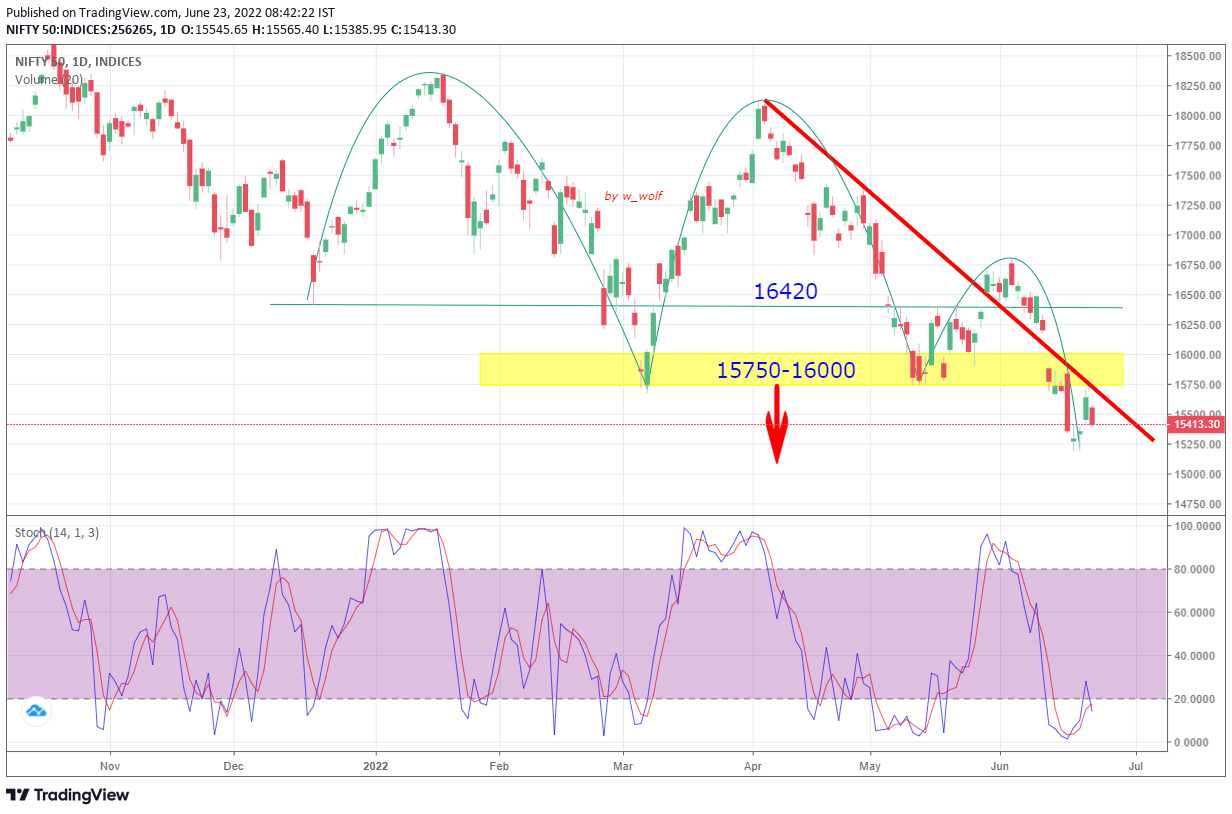
NIFTY daily chart view
As per daily chart structure, NIFTY will face strong supply zone in the zone 15700-16000. Moreover as long as trading below that zone, there is higher probability of break down below 15000 up to 14500-14400. Just a view.
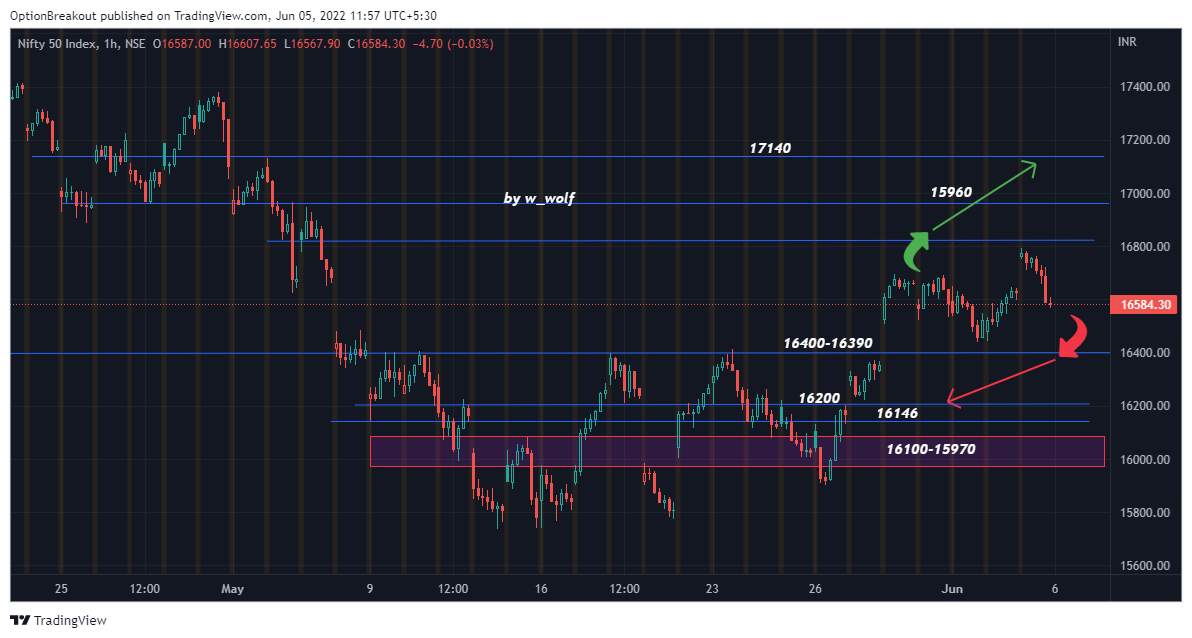
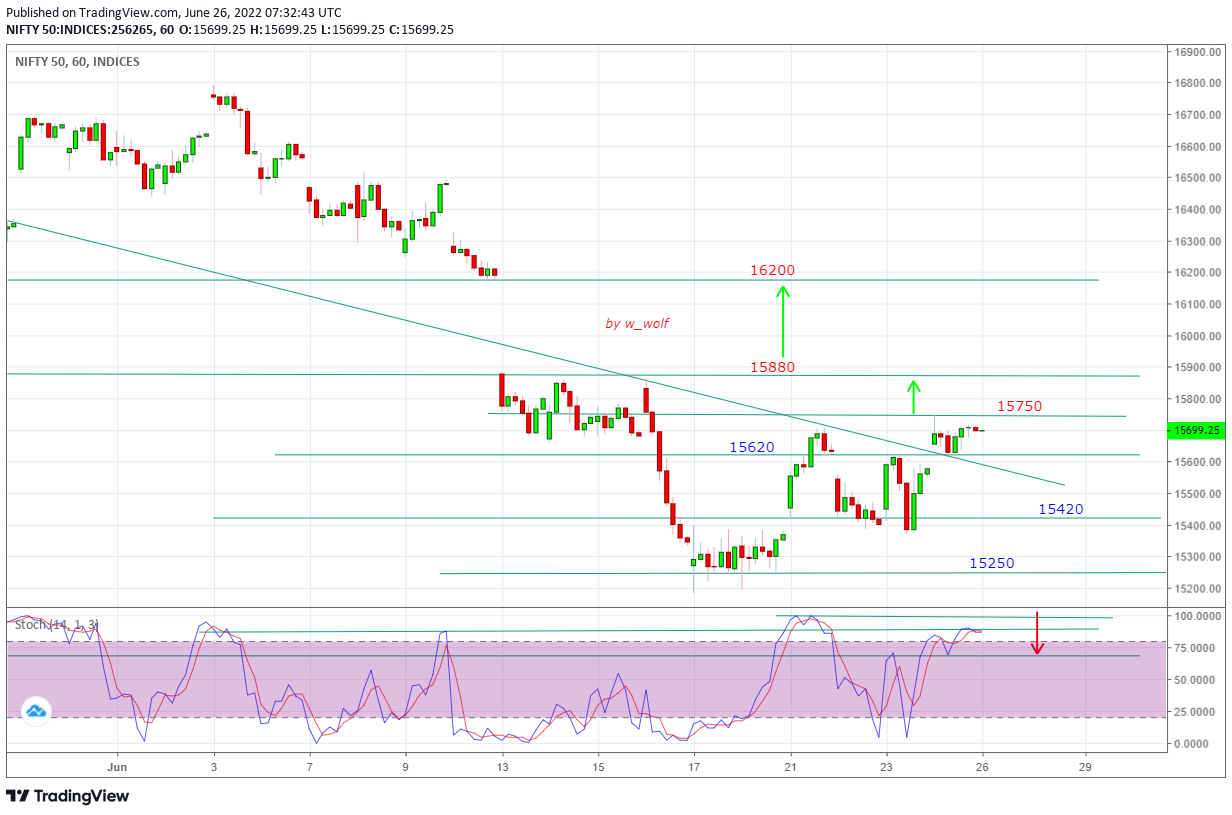
NIFTY hourly view
As per hourly structure it’s clearly visible that we are slowly approaching to a overbought zone. Suppose if we open gap up on Monday as per SGX showing around 150 points up move, we must be very very cautious above or around 15900 in spot. Unless sustains the gap up or shows strength above 15900 we must book longs whichever is for very short terms.
Purely for study purposes only ![]()
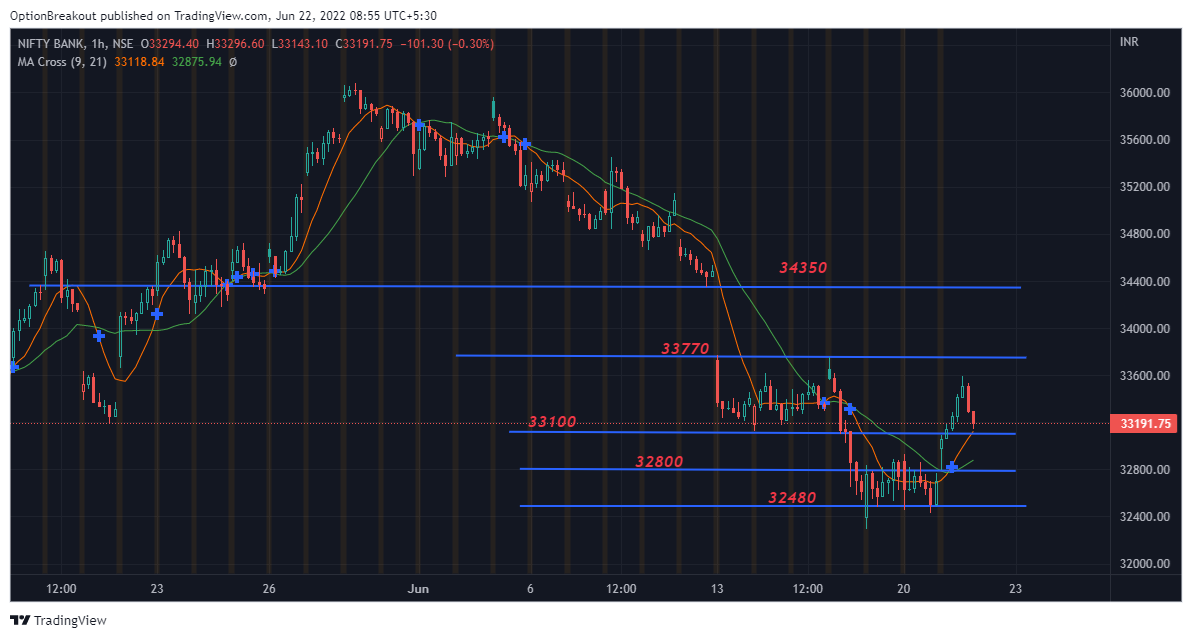
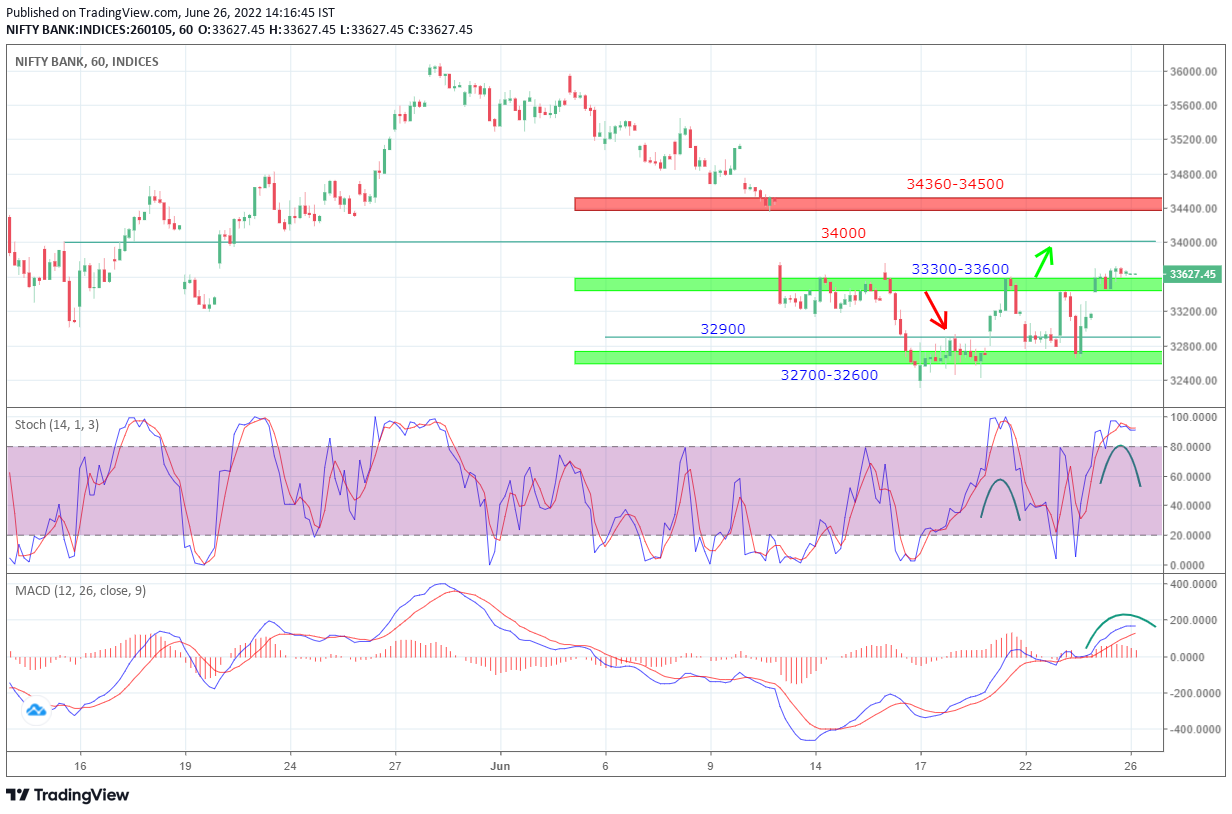
BANKNIFTY houly view
On relative basis, Banknifty is looking more prone to profit booking than NIFTY as per hourly view.
Agree…15800-900 zone is gonna be tough to breach…
Bulls can feel confident above 15700 …below that it is bear’s mrkt