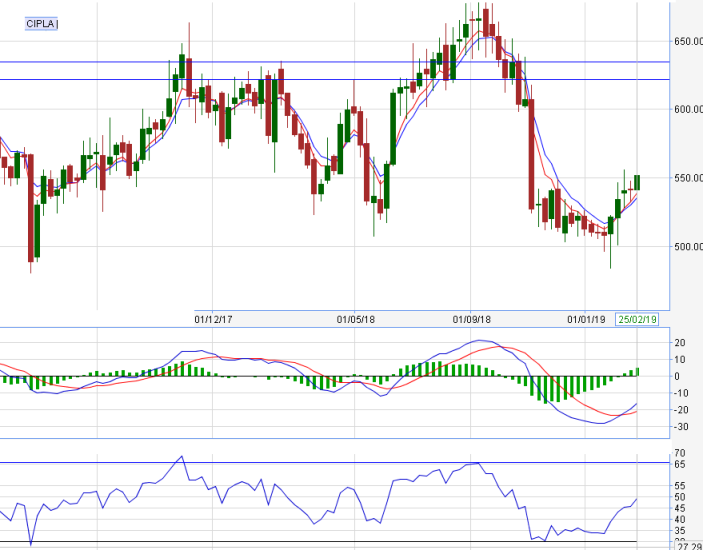
Cipla was trading around 630 on 1/11/18 and it went to 529 on 6/11/18, it was close to 16% down within 4 trading session.
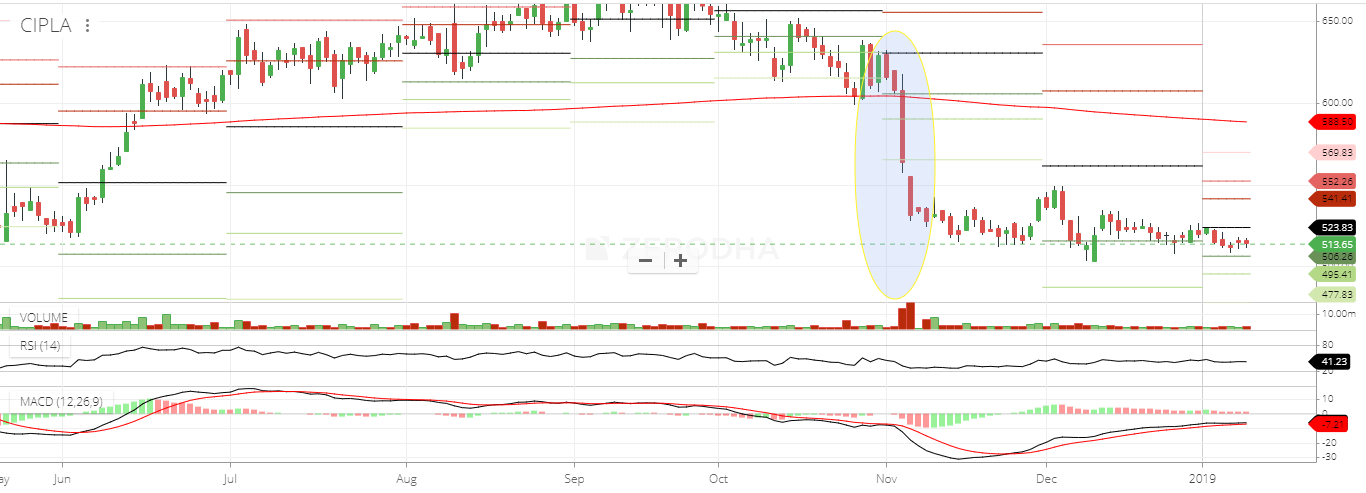
What can be the possible explanation?
Cipla was trading around 630 on 1/11/18 and it went to 529 on 6/11/18, it was close to 16% down within 4 trading session.
What can be the possible explanation?
I was searching TA threads on QNA , and i was also analyzing Cipla , its been bit late but my analysis about Cipla today and the date mentioned by you is that .
Cipla is in a trading range of more than 2years between Rs 500 to Rs 700, On 1-11-18 to 6-2-2018 there was a HS chart formation , and Cipla was near its higher trading range, Now again from lower trading range , there is break out on upside , so i assume Cipla will move up on higher side.