
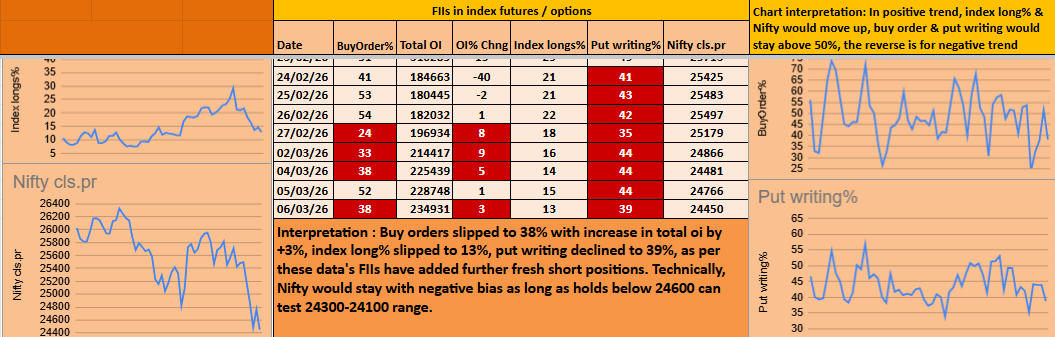
 How to Interpret FIIs Derivatives Data (Quick Guide)
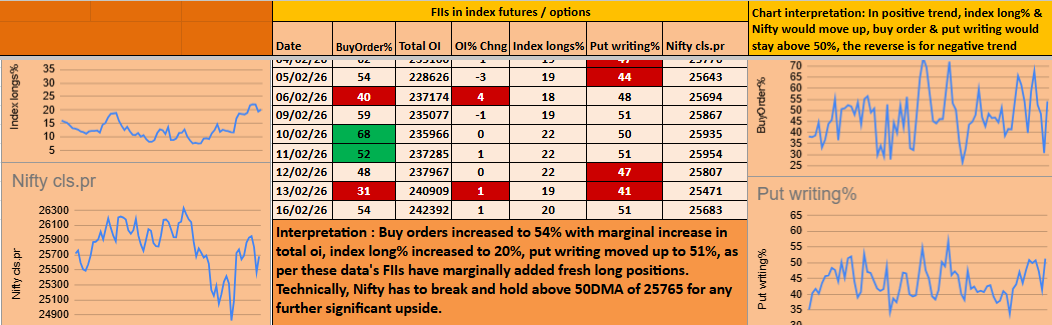
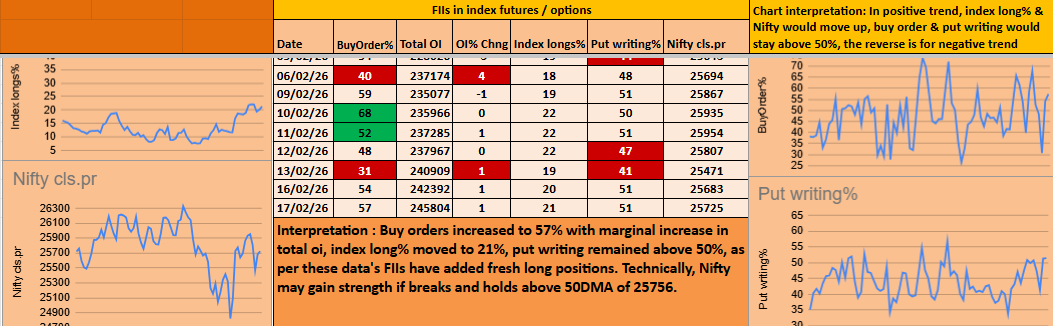
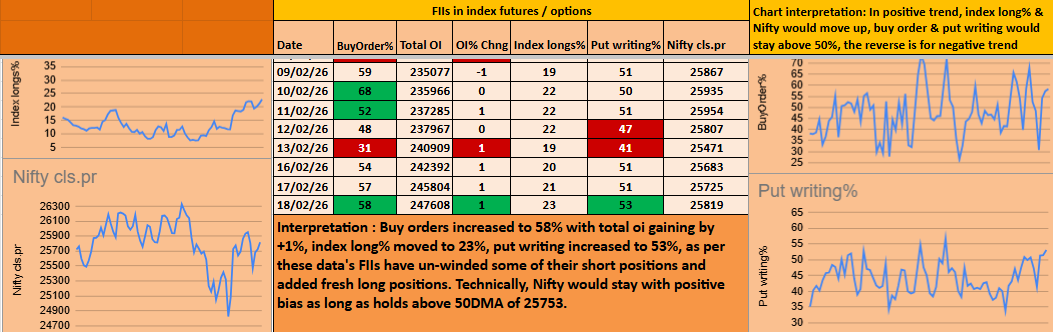
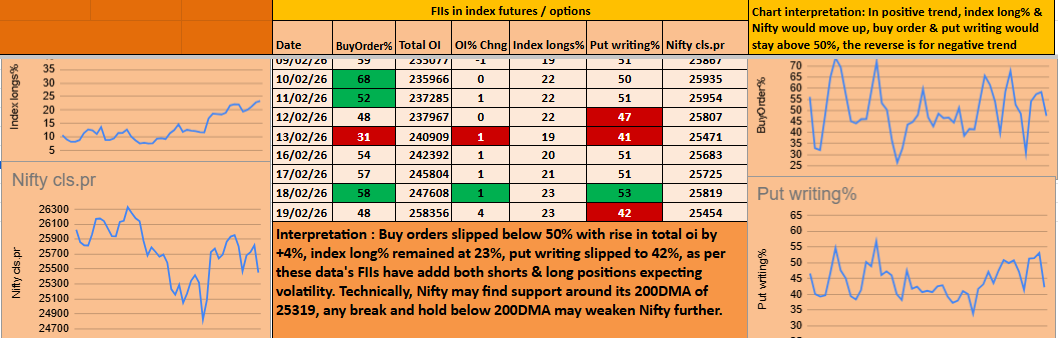
In the derivatives segment, FIIs usually hold around 15–25% of total open positions. Their fresh positions and unwinding activity often provide important clues about short-term market direction.
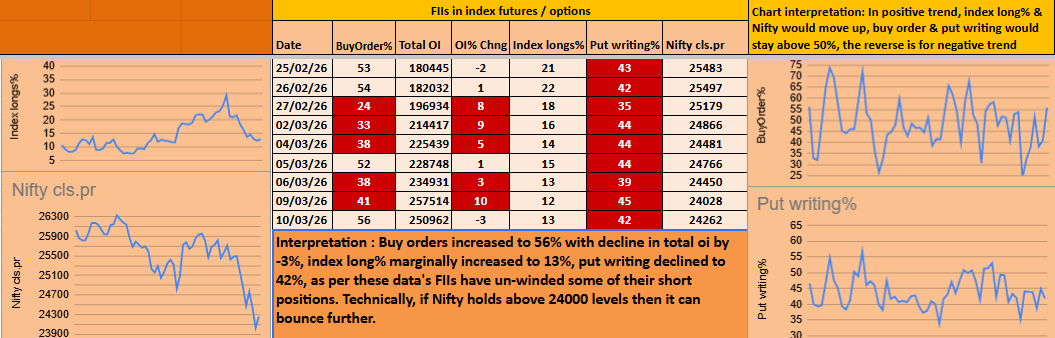
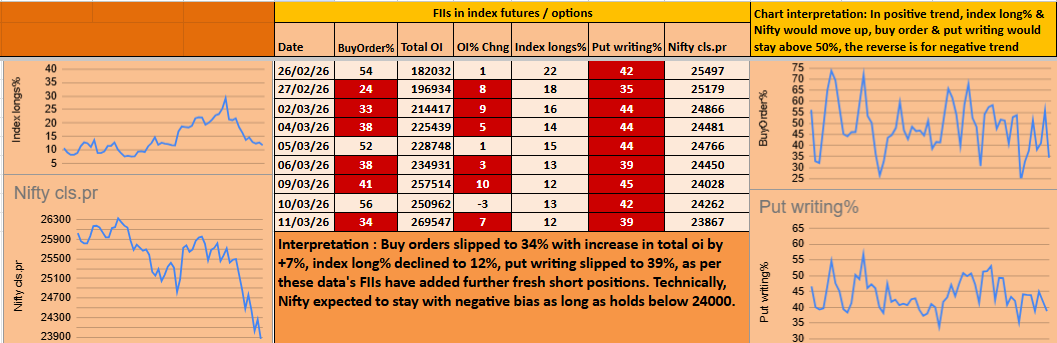
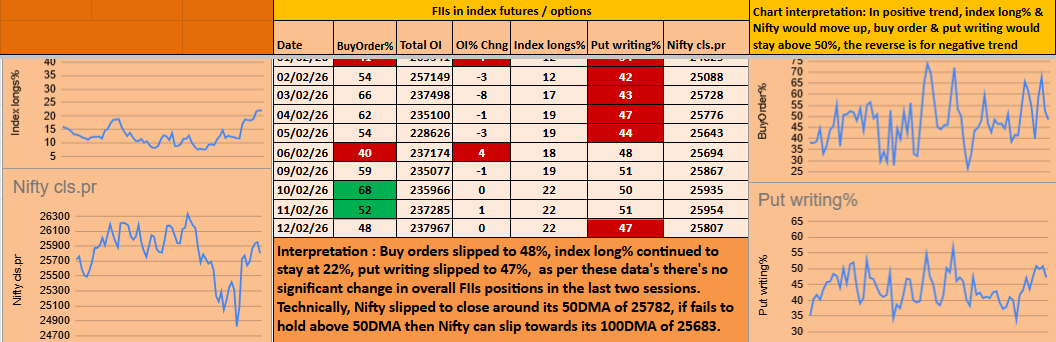
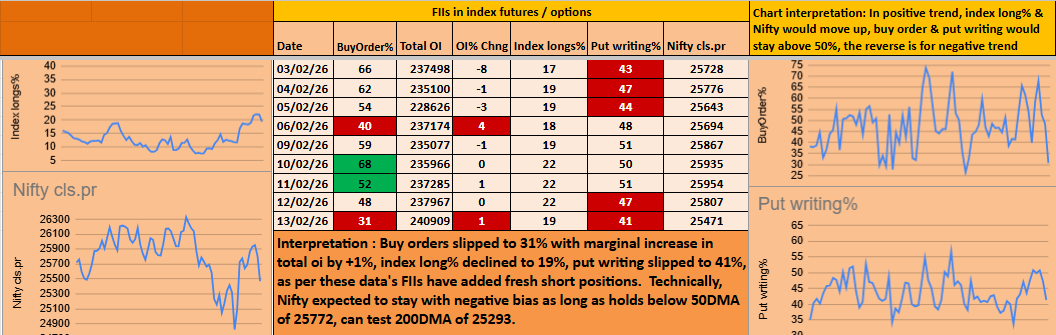
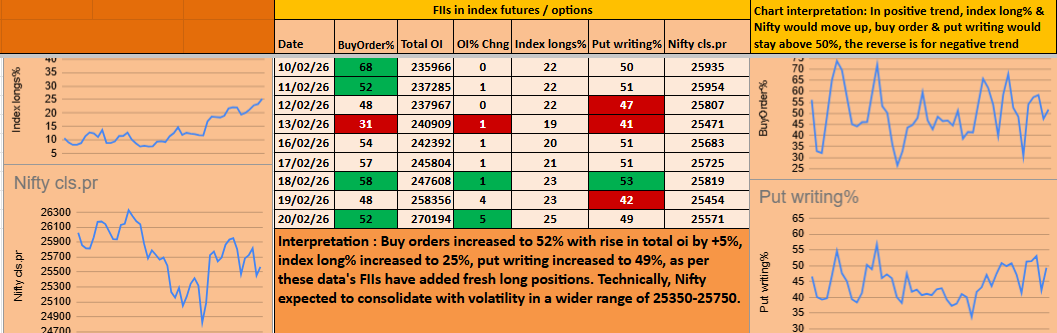
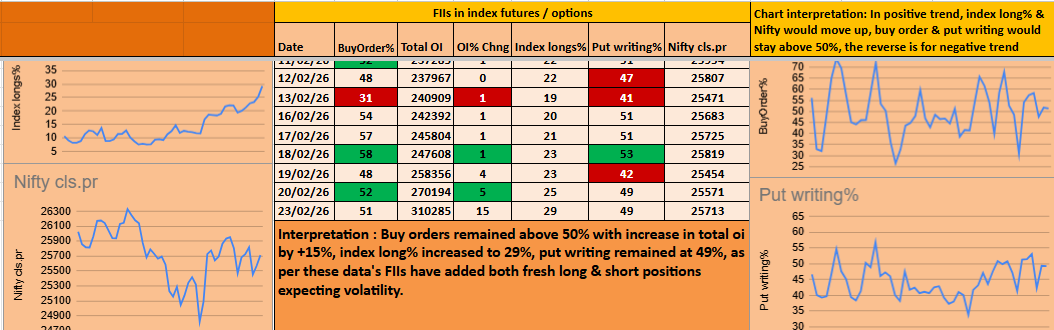
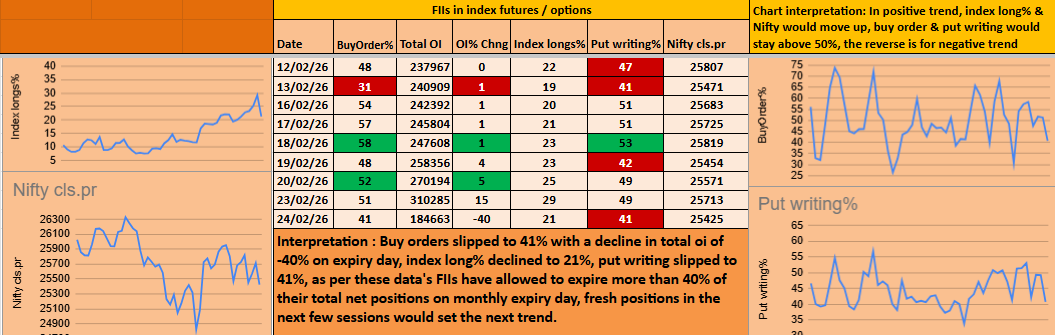
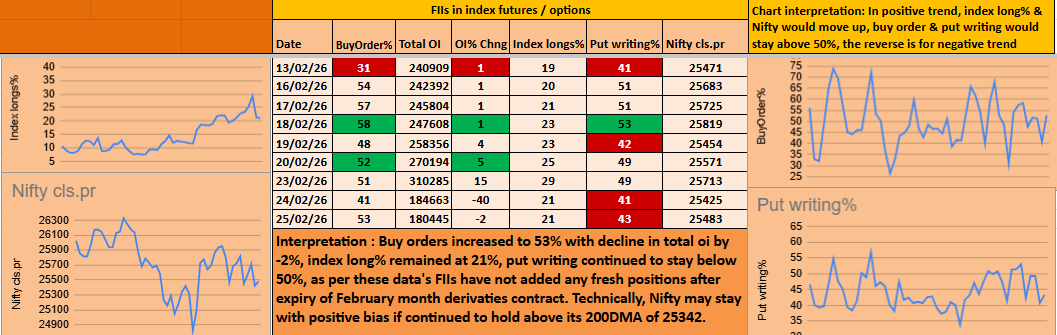
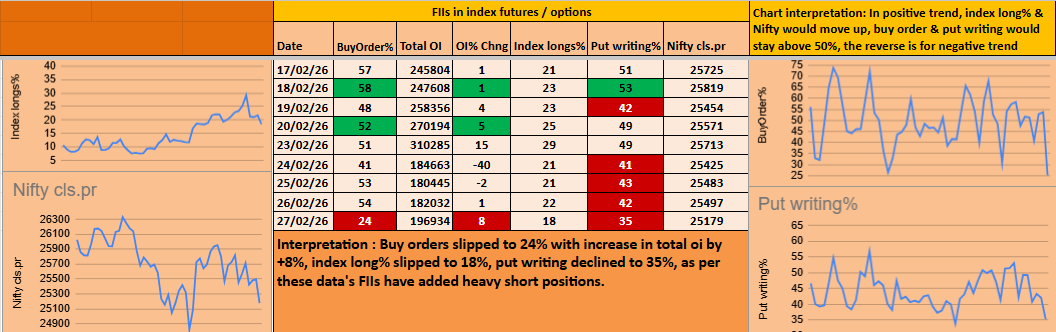
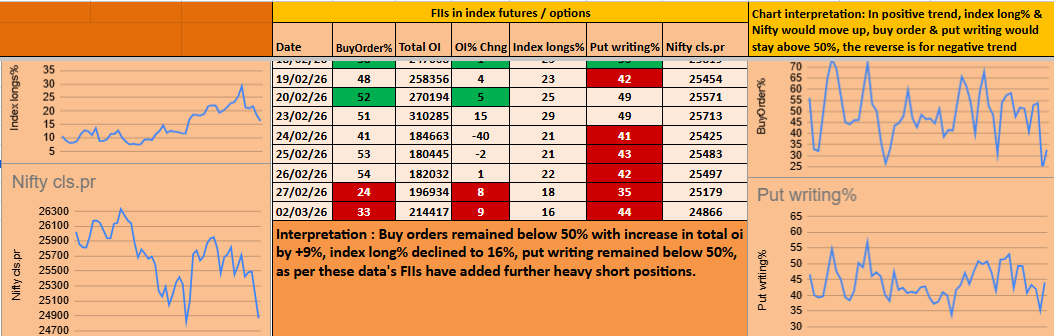
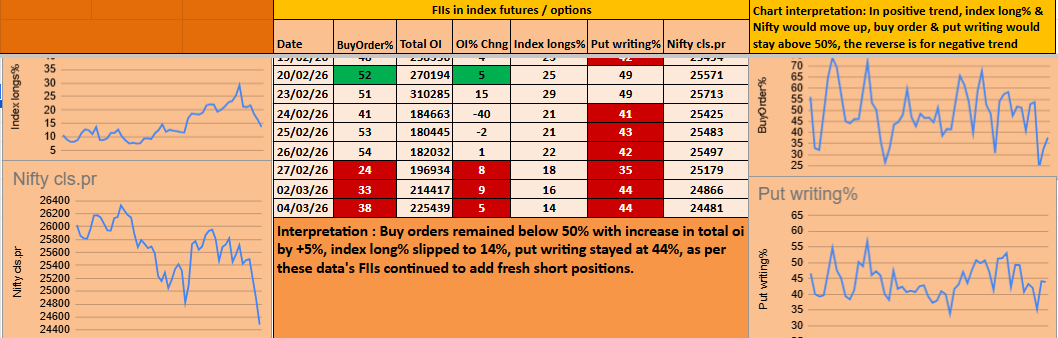
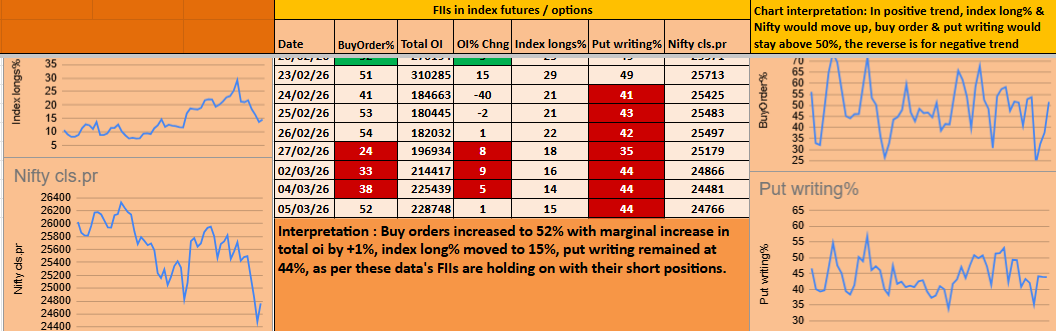
 Buy Orders %
• Above 50% → Positive bias
• Could indicate fresh long positions or short unwinding
 Total Open Interest (OI)
Total open positions in the market (Long + Short combined).
 Buy Orders + OI Change
• Buy >50% & OI rising → Fresh longs added
• Buy >50% & OI falling → Short unwinding
• Buy <50% & OI rising → Fresh shorts added
• Buy <50% & OI falling → Long unwinding
 Index Long %
Shows the percentage of long positions within total FII open positions.
Example:
Index Long % = 10% →
10% Longs | 90% Shorts
• Long % rising → Fresh longs or short covering
• Long % falling → Fresh shorts or long unwinding
 Put Writing %
• Above 50% → FIIs selling more Put options → Limited downside expectation
• Below 50% → FIIs selling more Call options → Limited upside expectation
 Conclusion:
Tracking FII derivatives data regularly can give traders useful insights about short-term index trend and market sentiment.
 Disclaimer:
This post is for educational purposes only. Derivatives data provides market cues but does not guarantee market direction. Always do your own research before trading.