nowadays heikin-ashi charts are quite popular is that safe to follow and is that reliable?
To answer your question, I will provide some background information that will make it easier for you to decide whether to follow the Heikin Ashi charts.
Basic Purpose: It helps you to enter and stay on the right side of the trend — or when in doubt, stay out
Meaning: heikin means "average" or "balance" in Japanese, while ashi means "foot" or "bar"
Calculation: The heikin-ashi candlestick technique uses modified open-high-low-close (OHLC) values and displays them as candlesticks. The modified values are computed using the following definitions:
- haClose = (O+H+L+C)/4
- haOpen = (haOpen (previous bar) + haClose (previous bar))/2
- haHigh = Maximum(H, haOpen, haClose)
- haLow = Minimum(L, haOpen, haClose)
Example Chart: Nifty Feb Futures Daily in Heikin Ashi Format
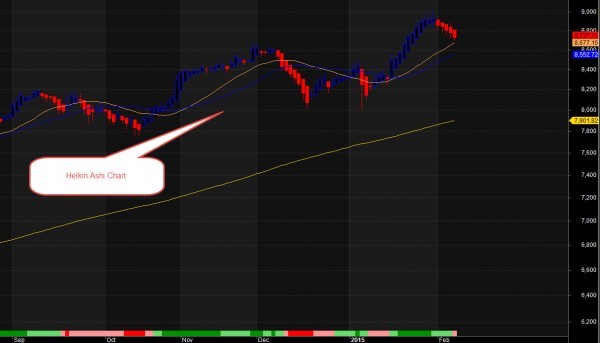
Interpretation: The heikin-ashi chart looks more compact and smooth compared to the traditional charts. Blue candles display a rising trend, while red candles indicate a downtrend. Gaps, which occur frequently on the traditional OHLC chart, are not present because they are incorporated into the modified candles. Strong positive trends have long blue bodies with no lower shadows, while strong negative trends have long red bodies with no upper shadows. When bodies become shorter, a weaker trend is anticipated. In an ascending trend, the emergence of the lower shadow suggests weakening. In a falling trend, the presence of upper shadows suggests weakening. Periods of consolidation are characterized by a sequence of smaller blue and red bodies with longer upper and lower shadows. In some cases, the emergence of a candle with a small body and long shadows suggests an imminent change of trend.
Please note that certain candlestick patterns can also be applied to Heikin Ashi charts for further readability.
Advantage: The main advantage of this simple method is a better visual perspective of the current status and strength of the trend or consolidation, and a possible anticipation of the next bar's strength. As with any other charting method, the heikin-ashi is not 100% reliable and therefore should be combined with other technical indicators. Your trading, of course, should also include risk and capital control strategies.
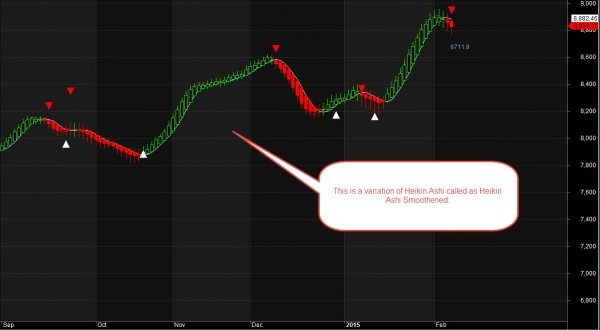
Variations: There are also other popular variations of the Heikin Ashi system like the Heikin Ashi Smoothened that applies a smoothing factor to the candles to further display trends prominently. An example chart of the same contract is provided below for reference.
Hope this helps. Let me know if you have any other specific questions.
10 Likes
Glad I could help 
thanks alot for this…
Hey everyone. I trade mainly based on heikin ashi. I have little knowledge about candles. Is it fine to do so?
I don’t think it is a good idea to follow Hekin-Ashi blindly. As per my knowledge, the actual candles tell more about the market behavior; Which will eventually make you a better trader.
BTW, there is no harm in learning new things!
Hope this helped you.
HIken Ashi make lost a crucial information, that big player enter the market. hiken ashi like other traditional indicator is basicly statitiscally, which is a lag indicator. if you will make a money you must capture soon any reversal, swing, that during pattern complete. so, a brave emotional and risk responsibly will be a key. if you want a sell, you must know who will buy, vice versa. thanks