Hi,
I wanted to understand the data in the screenshot attached since I am not able to make sense of it.
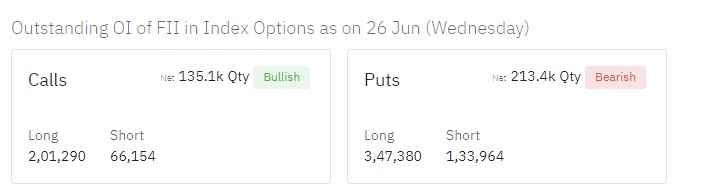
This data is of the FII activity for index options as on 26th June (yesterday) as it reflects on sensibull.
It says there were 201290 calls that FIIs went long on and 66154 calls they went short on while the net was 135.1k. What I am unable to make sense of is how can longs and shorts be different from each other?
I understand the basis of both long and short is different, but for every seller of options there has to be a buyer, which means the bought quantity should be the same as the sold quantity. Hence when I see different long and short numbers, I can’t make sense of it. Is there anything that I might be missing here?