There is always a magic formula which has a variable that depends on the ODDS or Probability. Also you will understand, why everyone says to read varsity after you go through the answer. (Pun Intended  )
)
Still want the holy grail. Here is the answer you are really seeking…
I will use the quantitative method, which is straight forward maths and probability. To understand the odds where the price will be after one day, week, or a month, one major assumption needs to made. That is price follows a “normal distribution”. Google is your friend to learn a lot more about these probability concepts. Diving in to the answer…
How to convert the volatility mentioned in the NSE website / Option chain into the price range of the instrument?
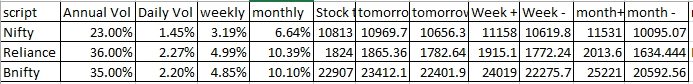
Lets consider the most volatile instruments, Nifty, Bank Nifty and Reliance in market. Their volatilities are are average around 23%, 36%, 35% respectively. I am taking these from the option chains using the near month data. I am also skipping lot of theory, which can be learnt in schools and colleges, and anyway we prefer practical stuff not going into that.
Zoom in the image, it has the volatilities entered, and followed with formulae for converting the above yearly volatility into daily, weekly and monthly volatilities. Then further formulae explain how the price are derived from these volatilities. All the columns and rows are identified, just copy the same in your excel document, and calculation will come alive.
These prices are just 1 standard deviation from the mean of the prices. The probability that in a given day, week or month the price will be with in this 1 SD range is 68%. Converting this probability percentage into frequency gives you the odds. This is one important way of thinking if you want to use the holy grail formula which has been shared above. 68% means, 2 out of 3 times the price will be within the range of 1 Standard Deviation.
The calculation can be extended to 2 standard deviation, where the probability of price being in the range of 2SD is 95%. In case of 95% odds are is 19 out of 20 times the price will be in the range. Thinking this way is important, and needs to practiced.
This is quantitative way of locating the price range. In case of quantitative way, there is always clear odds. Then there is technical way of using price action, resistance, support, wave theory, Fibonacci theory and so on… to locate price range. Here the odds are not very clear, unless you do a lot of chart analysis of the past. Finally using the econometric way of analyzing what is happening in the world and arriving at price. Same for econometric way, there is no clear odds unless you do lot of analysis of the past.
Happy Quantifying the Market…