How to download historic say for an year or more intraday stock data?
you have to contact private data vendor for intraday minute data and for daily data you can get it from nse bhavcopy here
There are many ways to do this, and the excel automation way would be to use APIs that are around. Kite itself has got its API, which you can use https://kite.trade/
Another very useful api is Alphavantage api. https://www.alphavantage.co/
I am just a user of this API, and it worked very well in excel. You can simply use a function to get the data. Neat thing is, you can then start writing trading systems on top this data if you understand the calculations.
There are other long winded method of scraping the data from the web, however recent web pages make it cumbersome. I am sticking with Alphavantage for time being. If anyone knows, something better, please share here.
1 Like
Hey thanx for the reply…
I am a non techie, so can you explain a bit more about the usage of the api?
And how to use the api and excel to get the intraday data?
Best to go with excel add-on.
Just visit the alphavantage.com, follow their instruction to download the addon and install.
After installation, the help provided by the add-on is self-explanatory. Below is a sample picture of how the function can be entered
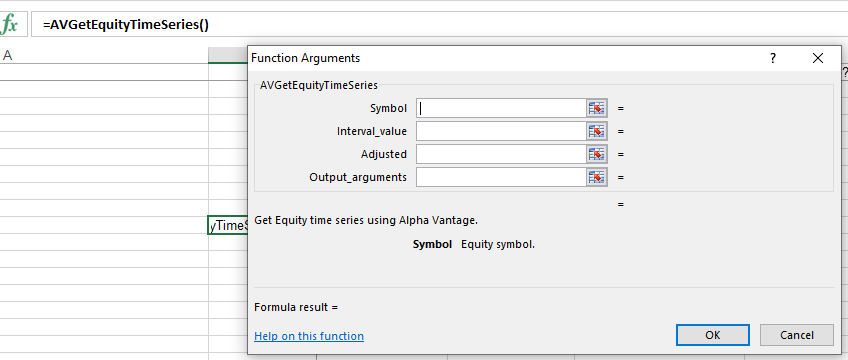
You can enter the symbol, interval etc as shown here and you will get the value as below
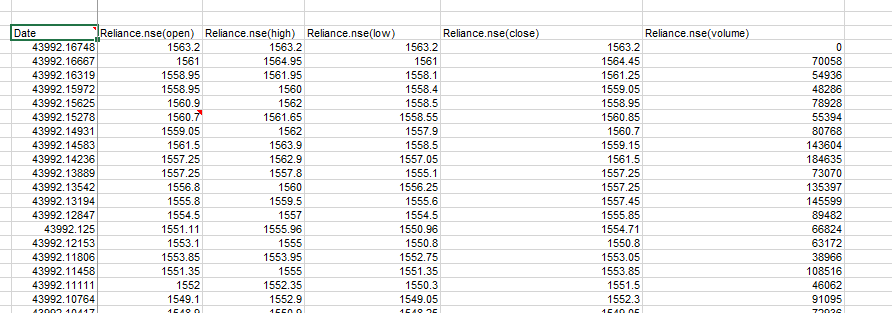
That simple, and once you the values in the excel next you can run various calculation starting with moving averages up to volatility. Bit of math, statistics and whole lot of creativity in twisting the numbers is required. It is fun though, like making 2 min maggie.
Hey thanx for the reply.
Yeah i tried this add-on option of alpha vantage through google sheets.
But i was only able to get intraday 30minute data for last 30 days only.
Is there a way so that we can get historic intraday 30minute data for an year or more?
I remember that in Zerodha’s PI, you can get it. However getting it for entire year might be tricky to impossible. I suppose you are trying to backtest your trading system?
Yeah in zerodha pi, i am able to get the data of last 60 days.
And yes i wanted to test my strategy and for that i was thinking that if i am able to test that on a data of one year or more then i would be much more confident about the strategy.
But i have been failing to fetch the intraday data for an year or more.
It would be of great help if you could do the needful and suggest a way to get the intraday data for a longer time period.
We are on same boat.
I too was searching for this data, and the solution is to buy the data from data providers for a fee. Instead of going one vendor after another, I decided to give streak a try. It has a robust commands, and interface. Have you tried BTing in that?
Oh wow so you are a paid user of streak?
How is it working? And on how much duration of data can we check our strategy ?
And sorry I didn’t get what you said “BTing”?
Sorry to use jargon… BTing is Backtesting
Disclaimer: I am not endorsing streak from the point of creating profitable returns, but from the perspective of learning about the price action and market as the whole.
Yes, I paid for streak and learnt a lot in parallel from various books like Super Trader, Position Sizing Guide, Way of Turtles. The beauty is, when you learn the statistical backtesting methods you can practically try it out in Streak.
I took it up on myself to go indepth and learn about technical indicators, trading systems, market micro structure, Returns calculation were required to make the usage of streak worth while.
How is it working? And on how much duration of data can we check our strategy ?
[answer] It really gives you clear statistical picture of the stategy. It is a great product if you are searching or creating systems.
Data resolution depends on the interval you are taking in Backtesting. If you use 5 min interval it is 3 month, if I remember correctly. (@siva, @streak can correct me)
If you use 1 hour interval then, till 1 year can be tested. Also you can decide the start and end date of the testing too. That is what you are looking for, correct?
To add cream to the cake, there is Deploying strategies, screener and Paper trading.
You can get streak to filter the universe of stocks in the market based on the price and volume action using the screener function. Automate your trading by deploying your strategy that you write. You can also do paper trading and understand how the trades get executed.
All said, I loved the way streak helped me out to learn a lot about the markets in short time. (Really thanks to COVID and my Dad’s insistence, Streak was my video game for 15 days and nights). Streak’s help is well-rounded with video and written content. Streak introduces lot of strategies too, and explain a lot about price action, technical analysis, chart reading.
There are shortcomings too, like it is not a complete trading system builder. It lacks forward testing feature. Much more could be added from the simulation perspective, which for sure @streak must be working.
I am not exaggerating, it is high speed race car with automatic gear box. Learn where the accelerator and brakes are, add fuel (Discipline, Money, Time, Passion) then you are on to Highway. Happy trading.
6 Likes
Woah… REALLY thankyou brother for such an elaborate and wonderful reply.
Frankly speaking rather than collecting the data now you have made me more curious to gather more USEFUL and HELPFUL information from you about intraday trading that you have learnt during the covid lockdown.
Can you share the source of learning and is there any reliable youtube channel that can help in our journey.
And convey my thanks to uncle(your dad) for adding you to the community of traders.
This is a long one… Bear with me!!! 
Step 0 : Before we trade, Trader must ask against who I am trading? Trading is a zero sum game, so the person at the otherside of the trade can be informed trader, bluffer, arbitrageur or a hedging dealer. The most dangerous of them all is your “Future Self”.
Step 1: Traders must really learn to let profits run and curtail losses. This is one thing that I really excited me. It is achieved by using stop loss as a mechanism to book profit.
I thank Van Tharp’s Super Trader, Position sizing books. A Must read. Credit goes to TradingQnA brothers who introduced these books before 3 weeks.
Below is very brief idea how it works. I urge you to read the book to get full understanding of the system. The books are widely available in internet, bit of searching is required. I have tried what I show in intraday rallies with Reliance, SBI and many other scrips.
Assumption: You have a system for entering into a trade, say fundamental, technical, astrological, roll of dice… you name it. You have 10,000 INR for trading,
Your system designates the position, entry price, target price and the stop loss price.
Example:
Position : Long
Entry : 100
Stop Loss : 90
Target : 110
Based on position sizing theory you can only risk 1% to 2% of your money. If you risk more than 3%, then you have high probability of going bankrupt and closing the account. (Read Position Sizing book or listen to van tharp in youtube for details) For the above trade, you can only risk 100 ~ 200 INR. Read the line carefully, you can “risk”.
Step 2: Decide your risk , in this case 100 INR.
(Risk / stop loss) will be your position size for this trade.
Since your stop loss is 10 INR lower than entry, your position size is 10 shares (100/ 10). Not one share more than that. This is the biggest trick that I learnt, and it has a different psychological impact.
Now you start trading with yourself. No, there is no opponents here. It is you and your EGO.
Case 1 : Market goes against your position
In this case, market goes down and the mental stop loss gets triggered. You don’t place the stop loss in the trading system. (Read Trading & Exchanges to understand why not to keep stop loss in the system). You have it in your mind. Since the risk here is only 100 INR, you can discipline your mind to exit the trade with the loss of 100 INR. You will don’t feel bad for the trade going against you. You are happy to trade, and learn.
Case 2: Market goes favorable to your position, however you don’t earn or lose money.
In this case market moves favorably towards 110, which is your target. Here you do the following. The mental stop loss is changed from 90 to 100(entry price) and then wait for the trade to continue. The market falls back to 100, and you exit the trade with no loss, no gain. You have to be strict, and exit at 100. Counting on Discipline. You are happy to trade and learn.
Case 3: Market goes favorable to your position, here you earn 3 times your risk.
Hour 1 : Market moves to 110 first, you move your mental stop loss to 100.
Hour 2 : Market moves to 105, you move your mental stop loss to 95.
Hour 3 : Market moves to 120 next, you move your mental stop loss to 110.
Hour 4 : Market moves to 117, you move your mental stop loss to 107.
Hour 5 : Market moves to 127, you move your mental stop loss to 117.
Bulls enter in full swing
Hour 6 : Market moves to 137, you move your mental stop loss to 127. Then market start reversing from 137 to 135 then 130. It is 3:15 and get out of the trade. End of Trading session.
Entry is 100, with risk of 100 Rs. You exited at 130 with help of your mental stop loss, not your target price, **note this.**You own 10 shares, so the total profit is 300 INR. Which is 3 times your risk. You are happy to trade, EARN and learn.
When you are right then make the most of it. Simple yet very profound.
Step 3: Ask, does my system have an EDGE? Simply put, when enter trade with your system how many times market turns favorable, and how many times it is against you. If you are right 3 to 4 out of 10 times the over all trading would be profitable. No need to be right more than 5 times. One place, where getting less than 30% will make you succeed. 
Step 4: Be disciplined, and have a business plan for your trading with a ultimate goal. This is way more important. Mark Douglas, Van Tharp, Richard Dennis and many great wizards have beat the market because they had a clear vision, mission and goals etched out. I thank Market Wizards series for introducing the various wizards and turtles to me.
There you go. I have given a simplified outline. I urge you read more from the following books and resources. Concentrate on learning the art and science of trading. It will transform lives.
You can read about the market, technical charts, candle sticks, option theory, psychological disciplining at Zerodha’s Varsity. My alma mater before I entered in real market.
My favourites are:
Think and Grow Rich by Napolean Hill
Snow Ball : Story of Warren Buffett
Douglas Mark’s Disciplined Trader,
Van Tharp’s Super Trader
Van Tharp’s Guide to Position sizing
Jack Schwager’s Market Wizard series
Tranding and Exchanges by Larry Harris, to understand the market microstructures
Handbook of Technical Analysis - The Practitioner’s Comprehensive Guide
Way of the Turtle by Curtis Faith to understand system development, testing, and reporting
Mastery by Robert Greene
Human Nature by Robert Greene
See you at the Top by Zig Ziglar
Most of these authors and ideas have been explained in youtube channels. Zerodha’s Streak has Youtube videos that introduces about the technical analysis, candle sticks and scripting. Zerodha has a Podcast, where great traders, market veterans come and discuss with Nithin, which is again valuable.
Last but not the least, read TradingQnA posts extensively. There is treasure trove of information shared by Nithin, Siva, Shubh, TradingQnA brothers, Streak and Sensibull team. I have been avidly following them, and their passion is commendable. Reach out to them, and they are very helpful.
Happy Trading (and Reading).
2 Likes
Superb Explanation, you should check out the platform that Streak has released for International markets, I went nuts after looking at it, the experience is just awesome. Streak.world , they have free trail so check it out .
Thanks,
2 Likes
Cryptic,
Streak.world and streak india version is similar. Integration is bit different.
In case of Streak India version, Kite interface, and the technical analysis interface are inside Kite only. Each equity/ commodity/ scripts technical / fundamental data can be called from Kite’s market watch.
From the 1st glance, what I could infer is integrating kite functions under streak (streak.world) gives more power to user than integrating streak functions in Kite(India version). I am sure Z team must be analysing these from the users.
1 Like