Just saw the volume profile chart for Nifty futures on Kite, how to make sense of this?
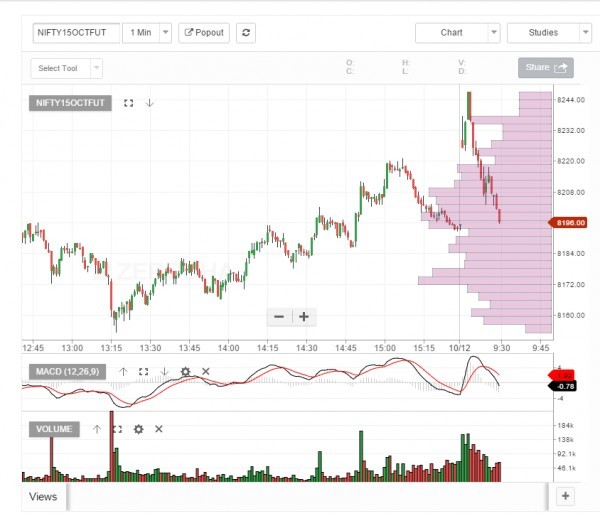
A typical volume histogram at the bottom of the chart shows you the volume at a particular time on the chart. In your example the chart is a minute chart, so the volume chart based on where you hover shows how many contracts were traded in that particular minute.
But what is probably more meaningful to know is the volume that traded at a particular price. Knowing this is helpful in making trading decisions. Kite, the web based app of Zerodha comes with an indicator called Volume profile that helps you in the same. This is the pink horizontal bars that you are seeing on the right.
Volume profile shows you the total volume at a particular price on the chart that is open. Market moves on higher volumes are always more important than those on thin volumes. So for example in the chart above for an extremely short term intraday trader, the top made at 8244 came on very thin volume, so this would have been a good indication to not buy the breakout in price.
If you are a Zerodha client, you can get this indicator on our new trading platform kite.zerodha.com
17 Likes
Any chances of making this feature (Volume Profile) available on Pi? If yes, that would just be too awesome and would put you guy far ahead of the already leading position that you are at :-).
Thanks and All the Best.
1 Like
Typically a Volume Profile chart is to read Volume at Price. A Volume at price chart is different from the volume at the bottom of a price pane chart, as it shows us where traders are trading or at which prices they are trading across a price range.
Generally speaking if the horizontal bars are longer , it would mean more people traded at that price or more trades happened there thus showing that the market sees that range as fair value. Conversely the thin vol bars are where trading did not happen or the market did not spend time there.
Thus we can easily see movement of price across the spectrum and the regions where it will stay or it won’t.
Prices tend to visit areas where the volume bars are more ( more cluster) and reject from where the volume cluster is less.
2 Likes
Congrats! vol profile is a great tool. Please add a line for peak vol price point as well or highlight PVP.
Another simple addition of vwap along with standard deviation bands would not be difficuilt for you and will make this with volume profile a complete package… Thank you and I hope you will keep improving in leaps and bounds our trading experience. The job is commedable.
vinay
3 Likes
can you make it available on pi in future?
Hi,
In other platforms, you can choose particular area on the chart and only for that particular area you can draw the volume profile chart. This is very useful. Rightnow, it is not clear on what data it is drawing the volume profile chart. Is it what is visibile time range on the screen area?
Thanks,
Satya
Hi Vinay,
Would like to know how I can use standard deviation with VWAP that you mentioned. In Zerodha Kite platform.
Thanks an advance
Snikam
I don’t think you can plot sd bands around vwap in kite. You can use other platforms like Amibroker for that purpose.
Hi Nitin,
I have one difficulty with this ,on any TF when we zoom in/out the total profile changes it does not remain constant,for ex. if Peak volume is at 500 Rs price then with zoom in/out it will change to 450 or 550 so how to use this indicator with accuracy ? Also I am not getting any details of how to use Time forecat, can you please help ?
Newbie alert… I’m using web platform kite. Can someone please explain what is the timeframe or dataset used to calculate the volume profile ?
It changes depending on zoom level for a given timeframe… Seems like it is calculated based on the number of candles visible (+ or - delta ) to the user…
2 Likes
hey there, i am a bit confused while browsing different time frames with volume profile. when we use 5 or 15 minute chart does volume profile covers only intraday activity or it covers whole price range that is displayed on the chart regardless of time period.
it covers whole price range that is displayed on the chart regardless of time period.
it covers whole price range that is displayed on the chart regardless of time period.
more candles on the chart the better, preferably daily candles.
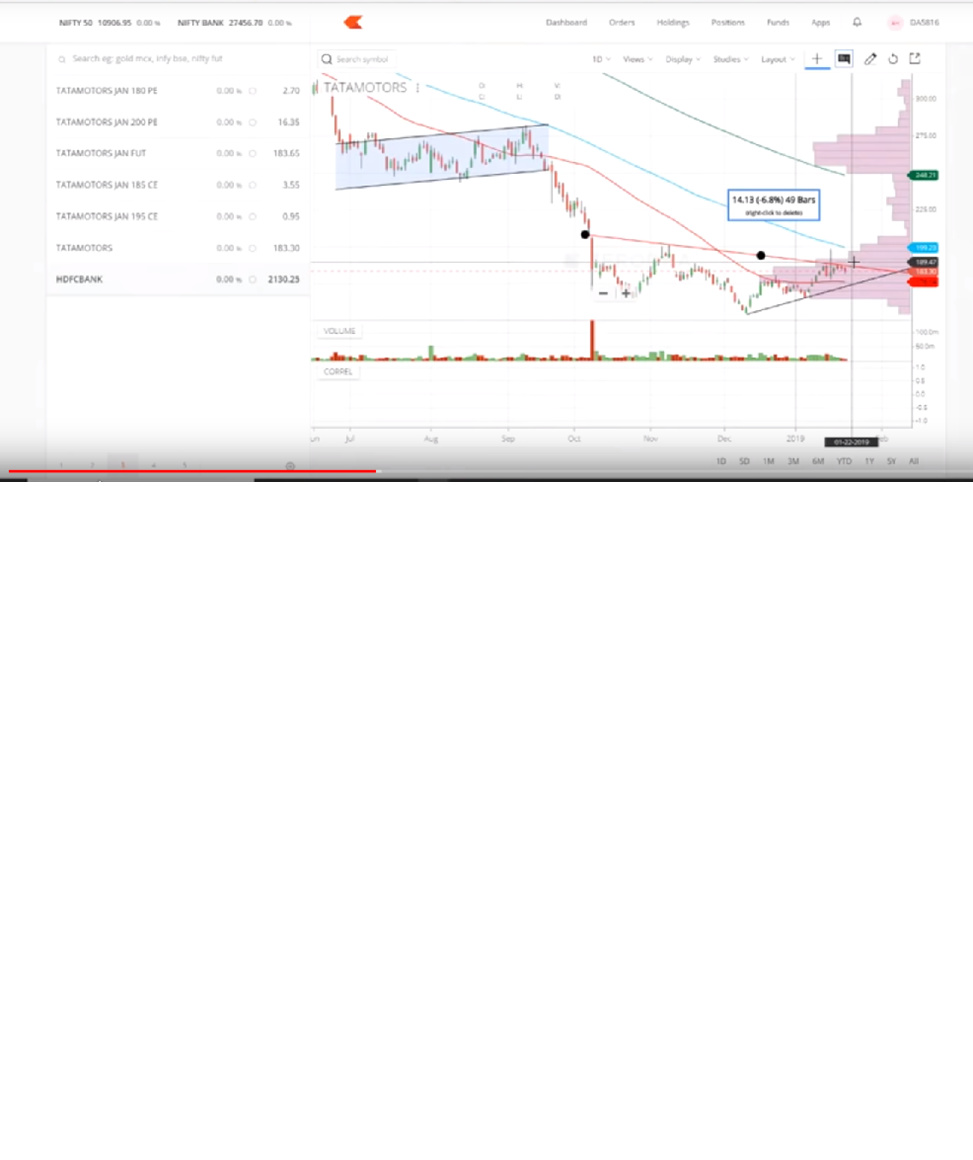
Any idea what is the chart layout for the attached picture
Also pls advise how to load a similar chart
1 Like
Thanks that was helpful
Can you please make Volume Profile (Visible Range) available in the Tradingview chart too please! That would help a lot!
@nithin
I have a couple of queries on Kite. I see that ChartIQ based charts have Volume Profile indicator, but TradingView based charts don’t. Does Zerodha have any plans to roll out Volume Profile indicator on TradingView based charts as well? Also, the Volume Profile indicator on ChartIQ shows volume bars which only represent overall volume - not buying and selling volumes separately (with two colours). Is there any work going on on this front? Thanks in advance.
Regards,
Vivek R Shenoy
3 Likes