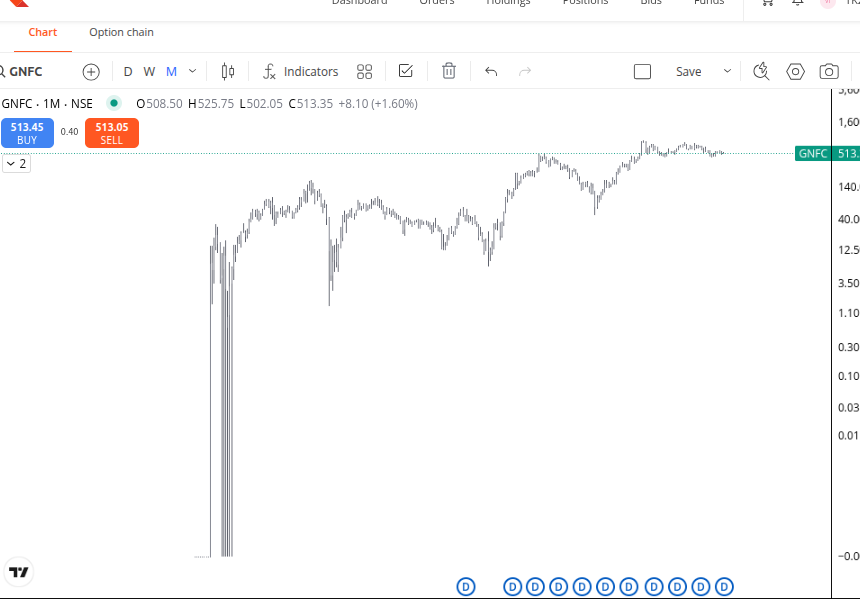
@nithin_kumrr chart of NIITLTD is still not fixed. Also check the chart of GNFC(monthly chart)
The charts for this instrument is already adjusted for the spin-off as per the COA provided by the company, which is 42.91%. There can still be a gap up/down after that, unlike other CAs. This is because the ownership structure itself has changed, and the historical data on Kite charts are adjusted as per the percentage of the Cost of Acquisition of equity shares in the Transferor Company.
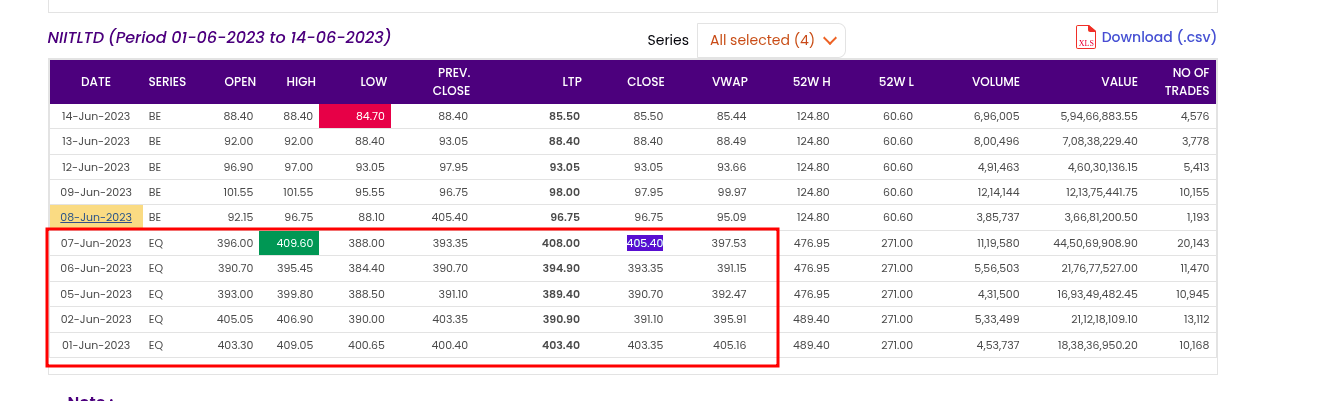
Below is the sample data from the NSE site before the ex-date
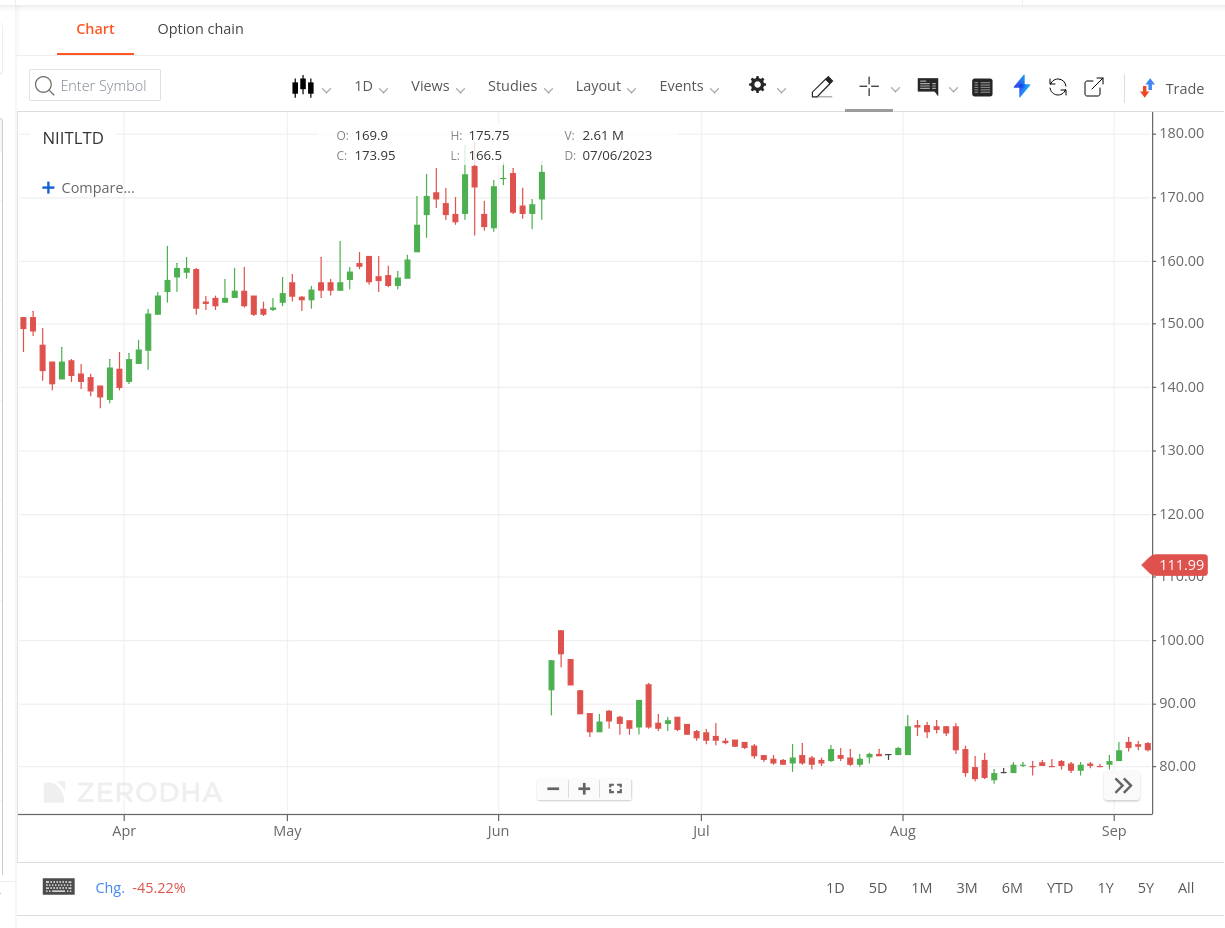
Below is the adjusted data shown on Kite charts before the ex-date.
Could you please provide us with more details regarding the discrepancy that you are noticing with GNFC charts?
Apologies for the delay. This will be done shortly.
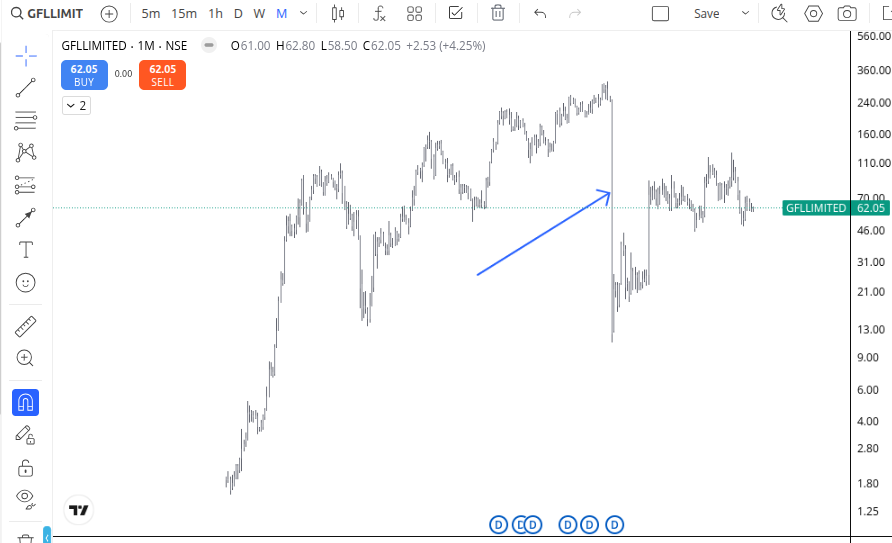
The charts for this instrument are now updated as per the Cost of Acquisition shared by the company.
GFL_demerger_COA.pdf (665.1 KB)