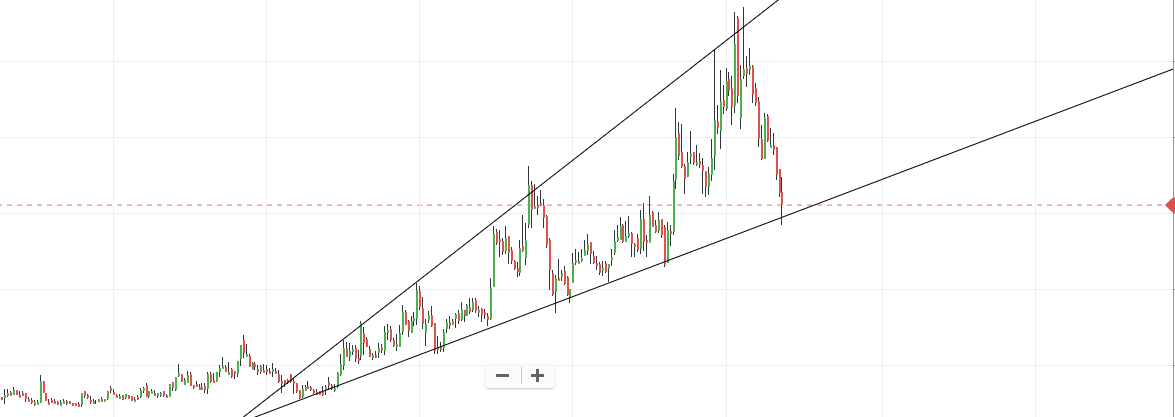
@leodecaps Great! Almost correct. Go-long if you see a reversal @the base of the wedge with a predefined Stop-loss and try to play the entire swing. In case there is a break of the pattern (base of the wedge) then Go-short immediately.
There is a high chance (70%) that the pattern will continue. So be prepared for a long trade. Best of luck.
Just by chart it’s not ideal to take trade. You have to ask yourself why will people buy it now that it has declined so much. What if the company is going through some trouble and with no recovery in sight like PNB or PCJ.
Thx for the detailed suggestion on this. can you tell what exactly is this pattern called?
haven’t been thorough the fundamentals though, thx for reminding me, will have to look into it.
for now i also believe, and its mostly being attributed to the downtime of all midcaps, so maybe its just following its index.
@leodecaps It’s the opposite of Rising Wedge Pattern. But definitely not the Falling Wedge Pattern.
One more thing you should keep in mind… Price not only rises for new buying by traders. Most of the time price rises in stock mkt for loss booking by traders (short squeeze). 95% of traders keep on booking loss most of the time. So Go-long with slightest sign of Bullishness like formation of candles like… Hammer pattern Or inverted hammer Or Morning Star Or Dozi Or a Green Morubozu, etc. Best of luck 
Thanx.
Also, it was so informative, thx for sharing this.
Charts drawn correctly , if, i have to trade this stock , i would avoid , it will fall further down
oh
can you tell the reason too, of how you can say so?
Can you tell which stock?
Is it Refex Industries?
[quote=“leodecaps, post:9, topic:39278”]
can you tell the reason too, of how you can say so?

a|690x244
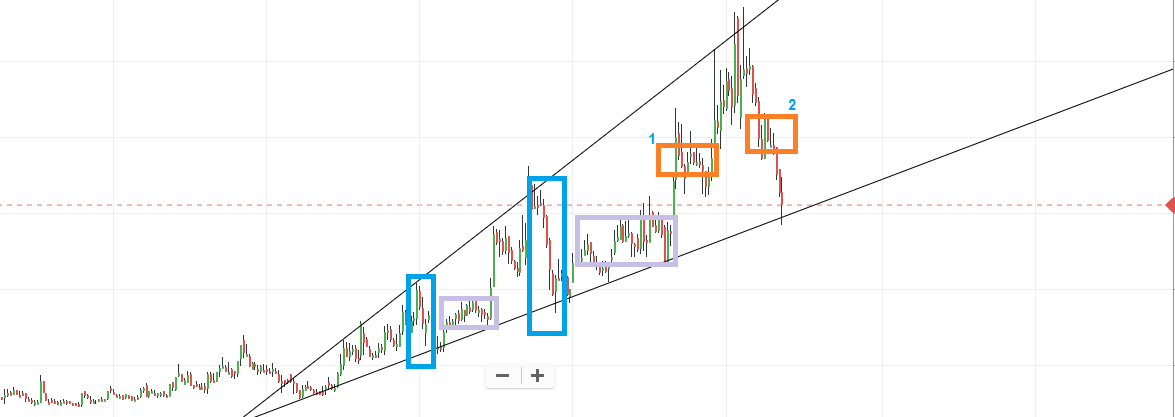
I am taking your chart to say why it will fall !!
If you look at the chart , in blue colored box , initially stock price went up , fell sharply, taken support at trend line, consolidated & went up again , happened twice . in orange colored box 1 , stock price went up , consolidated , went up again , in colored box 2 stcok price fell sharply " consolidated " and " declined sharply " so i assume stock price will continue to fall !!
I suppose to ask @ leodecaps before posting my view, well ,i was aware of it , While posting , my view was purely based on chart pattern/price action not based on particular stock name , ( possibly @leodecaps will name it !! )
Yes I dont have much idea about technical analysis, but if the OP provides stock name, it would give some idea for me whether its a genuine or fraud stock
Yes correct, i agree with you
thats a nice explanation. in that case, according to what you say more chances prices dont move up now, which opposes what trendline says that more chances prices move up now. also, colored box 2 seems less like a consolidation and more like a huge buying in between the sharp fall, infact there was a bulk order at that point too.
My point at colored box 2 was that , consolidation means , short covering by initial short sellers and also short selling by new short sellers ( vice versa for blue colored boxes), many times stock prices moves /continues , after consolidation , in the previous price direction.
By the way curious to know the name of the stock , is it Bharat Forge ? or …