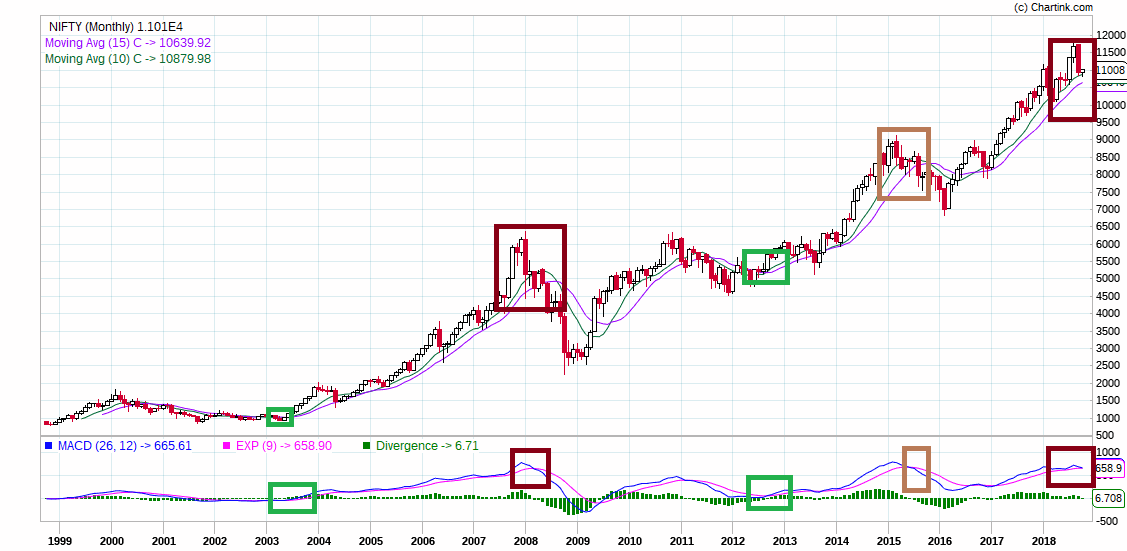
While studying long term Nifty charts , i observed an interesting thing between 2003 to 2008 and 2013 to 2018 bull run , both the up move was about 5 years , Considering in between correction on Nifty , up move on Nifty from 2003 to 2018 was about 15 years of 3 time ,bull run of 5 years each. Now the chart indicators , indicating the same condition between 2008 and 2018 , Only index stocks are moving up , while small & mid-cap stocks are making new lows. High volatility in stock market and chart indicators are indicating , bull run on Nifty50 is nearing its end or about to end, So share your analysis on Nifty50
Someone did very detailed analysis of this kind of move on Valuepickr forum
4 Likes
Thank you, i will go through it, and Value Pickr Forum seems to be vast sea of Traders & Investor’s opinion’s.
Nifty may bottom towards 10200 levels & if next year BJP is out then expect 8000 levels.
2 Likes
LOL… Doesn’t matter bjp or congress
Nifty has now gone below 200 dma so the 10k journey has begun
So now we should start investing by SIP method as it has already been corrected by 8-9 %? I see this fall as a best opportunity to invest
Yes the patient and the intelligent one’s should not shy away from the market volatility and use this time to accumulate …
I think time is not yet come for the investment , I assume , probably 8500 level is the better level to start invest , Market has become very volatile near to , next year Parliamentary election.
1 Like
I think kal clear ho jayega ki SIP karne ka time hai ya fir portfolio ke RIP hone ka time hai 
3 Likes
Im also thinking so… RIL and TCS two big shots of market has been down by 7-8% in last 7 days
 yes, SIP is really RIP & this is the time several guys who have done SIP start panic selling…as per ET reports already heavy selloff done by investors. TV ads on SIP stopped suddenly…many had got late into investing are staring at huge losses. If you don’t invest with proper buy/sell strategy you are set for disaster…
1 Like
Yes RIL down means mutual fund redemptions happening
which is even more scarier than FII selling
1 Like
how to get the information about the selling or buying by MFs/FIIs in a particular stock?
Sankat ke Badal Chaye huye hai… Now "Cash is only King ". one who has cash in account will rule the market
I dont know selling or buying by whom
But one thing you can check is which stock is held most by FII or DII
Like I googled on 2nd Oct, and I saw two stocks which follow these three criteria - 1) Huge FII Holding, 2) High PE, 3) Huge returns in last 5 years
Based on that I assumed soon they will be sold off by FIIs - They are EICHERMOT and PAGEIND
Is there any trustworthy site where I can get all the information together or just need to do random searches?
I used this one
https://trendlyne.com/stock-screeners/shareholding/highest-FII/now/index/BSE500/bse-500/
2 Likes
Thanks
Bhai maine toh dusre thread pe ek investor ko bola tha minimum 30-50% Mutual fund nikaal do 2 din pehle hope they heard me
Mai khud hota toh 100% nikal deta but dusro ko suggestion diya sochke thoda kam aggresive bola
2 Likes