Hello. i wanted to give a feature request, but could not find any option for it, so just adding it here if it could be addressed.
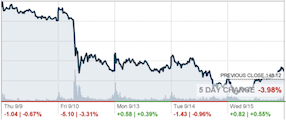
So in the holdings section you see the daily change and net change % percentages. Along with this, it will be great if you could add a small 5 day sparkline. It becomes very important for short term, traders to see the recent history specially if the stock is going down, they can decide if its good idea to exit or average etc.
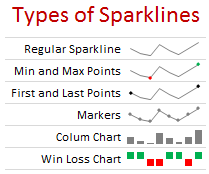
Its called sparklines in excel or used in sports e.g premier league tables to show recent win loss.
sample like this:
Would really appreciate if this is added, i’m sure it will help a lot of retail investors like me. It can only be on the web if thats easier than mobile.
Obviously we can see the chart,
but will prefer to see the chart only if its interesting, like if there’s continuous selling in 3-4 sessions, would like to see the volumes, or support levels, not on a daily basis, Plus the holding view has more details like our avg cost, current profit/loss etc, its very difficult to track that when you are in the chart view.
Going thru each chart just to see the trend is very cumbersome.
Good to know, I further checked and yeah, I see that they are still in the user manual pages, Portfolio - Kite User Manual . So it seems they have been recently removed as the pages are still not updated. It’s was a 52week sparkline. ahhh… it would have seriously been good the have.
Anyways, I can just hope you decide to add the same or or something similar back. (52 week was anyways too much)
Also on a second note, Im sure there may be other reasons for removing that, because no one complaining about it being removed does not seem justified, it could also be that they did not know where to complaint or if they could even complain or enquire about it.