I think there is some confusion about the functionality. There is no issue with setting up the default timeframe. Can you share the old ticket number? I will arrange a callback to address it promptly.
In the first reply, the representative didn’t provide proper guidance. If the person who was handling it earlier isn’t available, the ticket gets passed on to another person.
Based on tags, the relevant business analysis team reviews such suggestions and adds the feasible ones to to-do list.
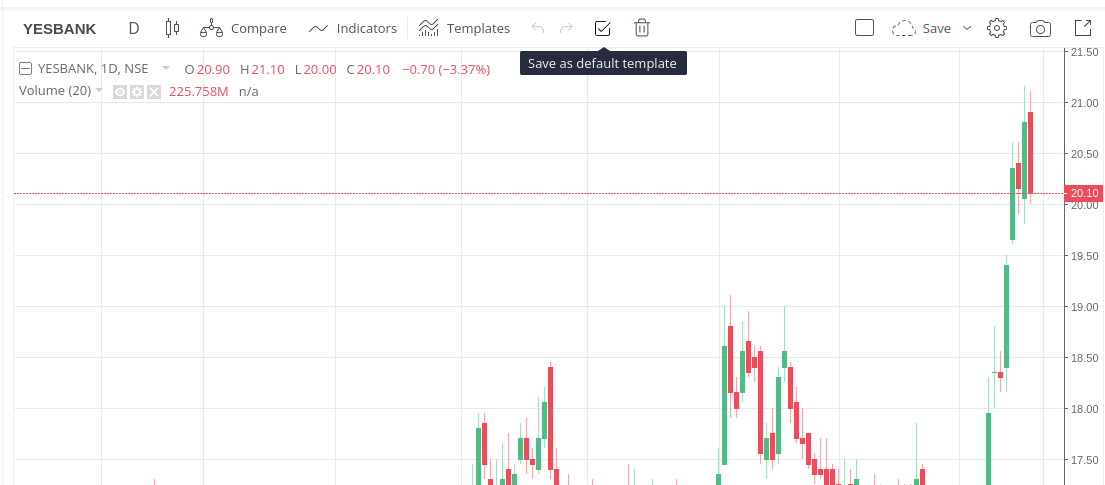
I encountered an issue with the candlestick, and you promptly highlighted the set as the default chart template. You had already resolved the ‘set as default template’ matter in another thread, and I truly appreciate your assistance. Thank you.
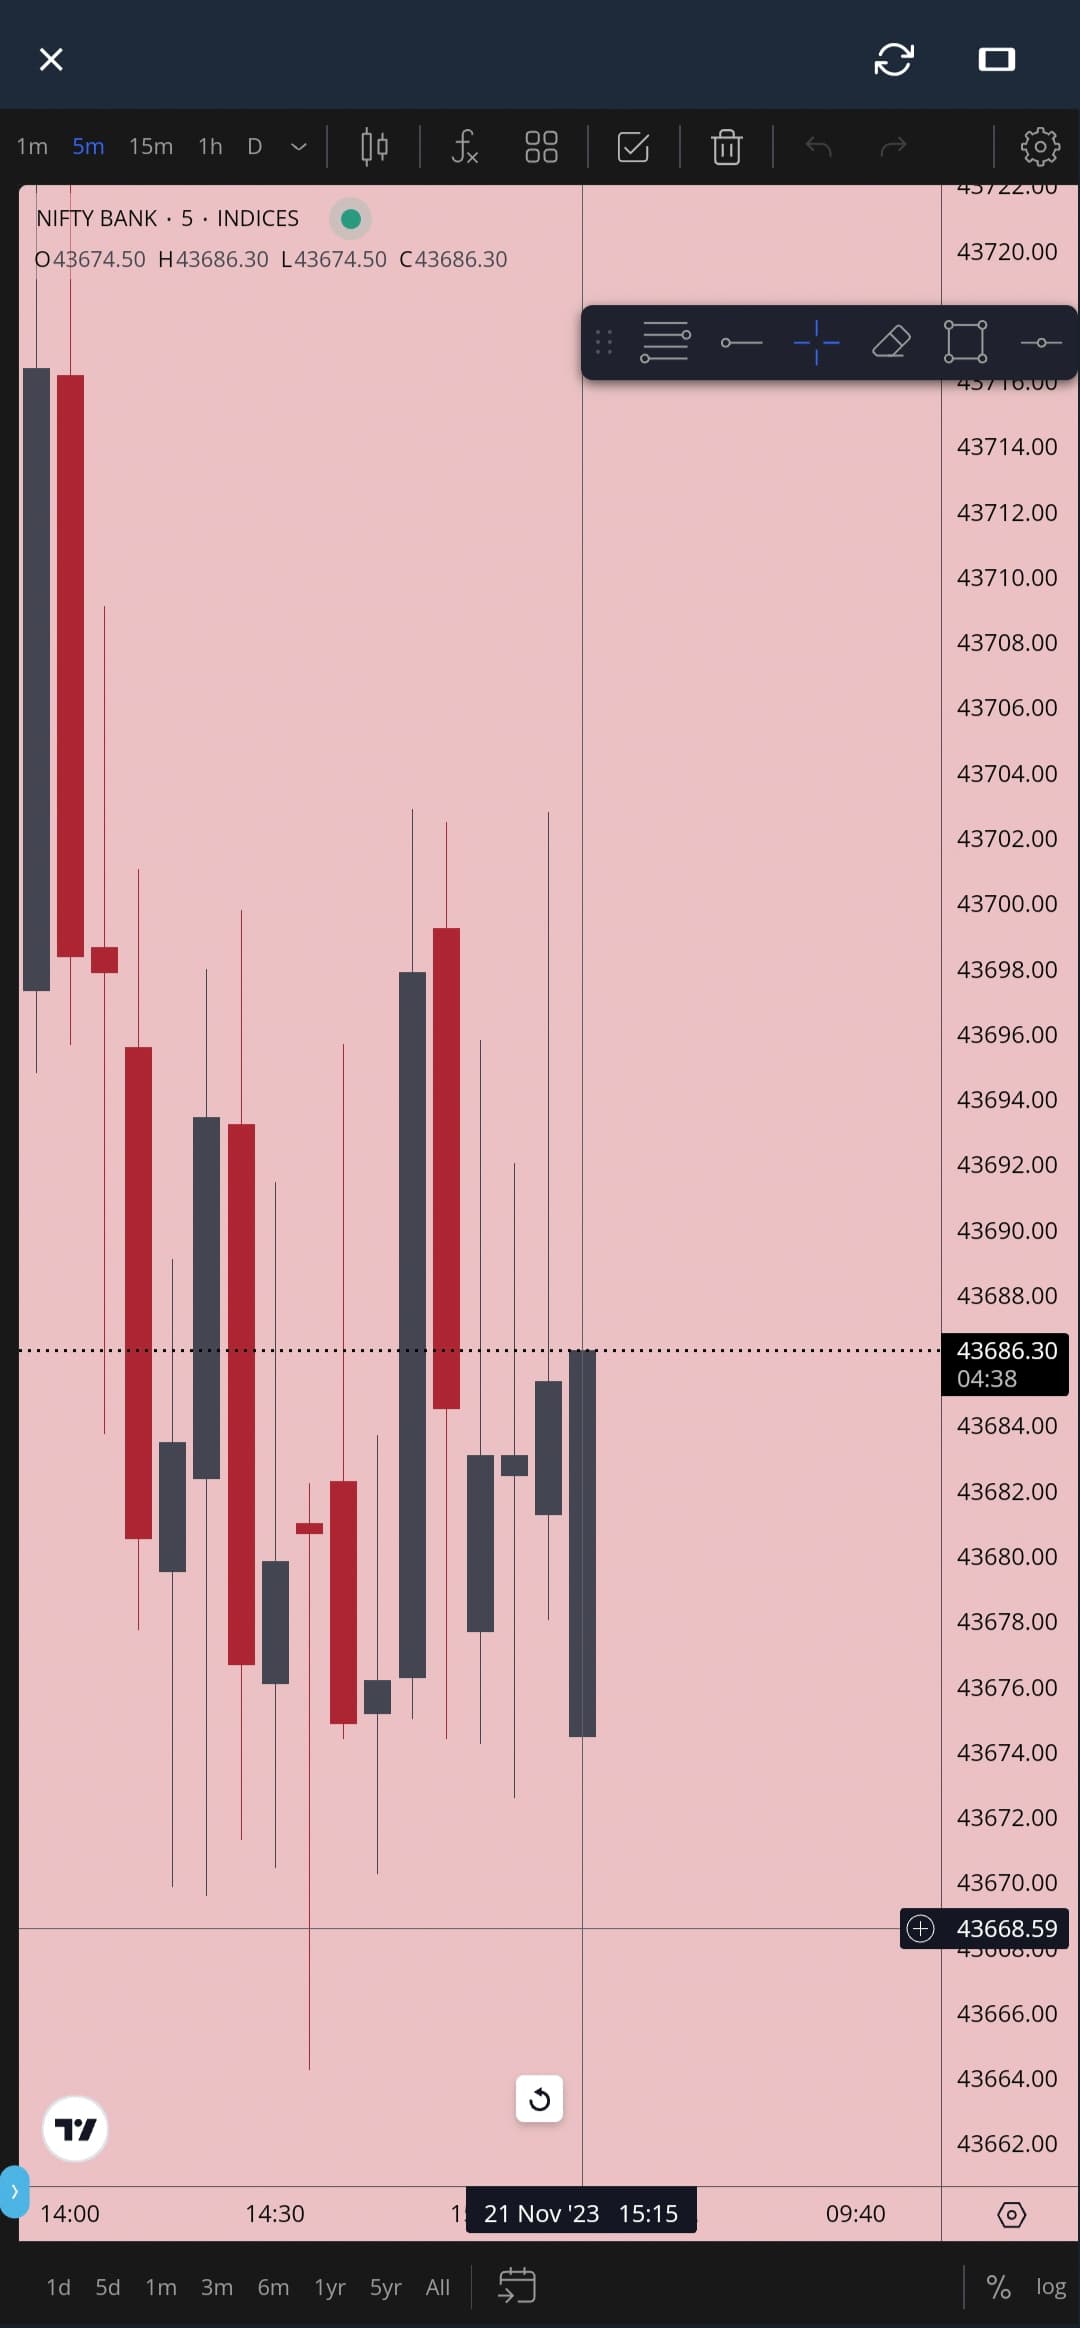
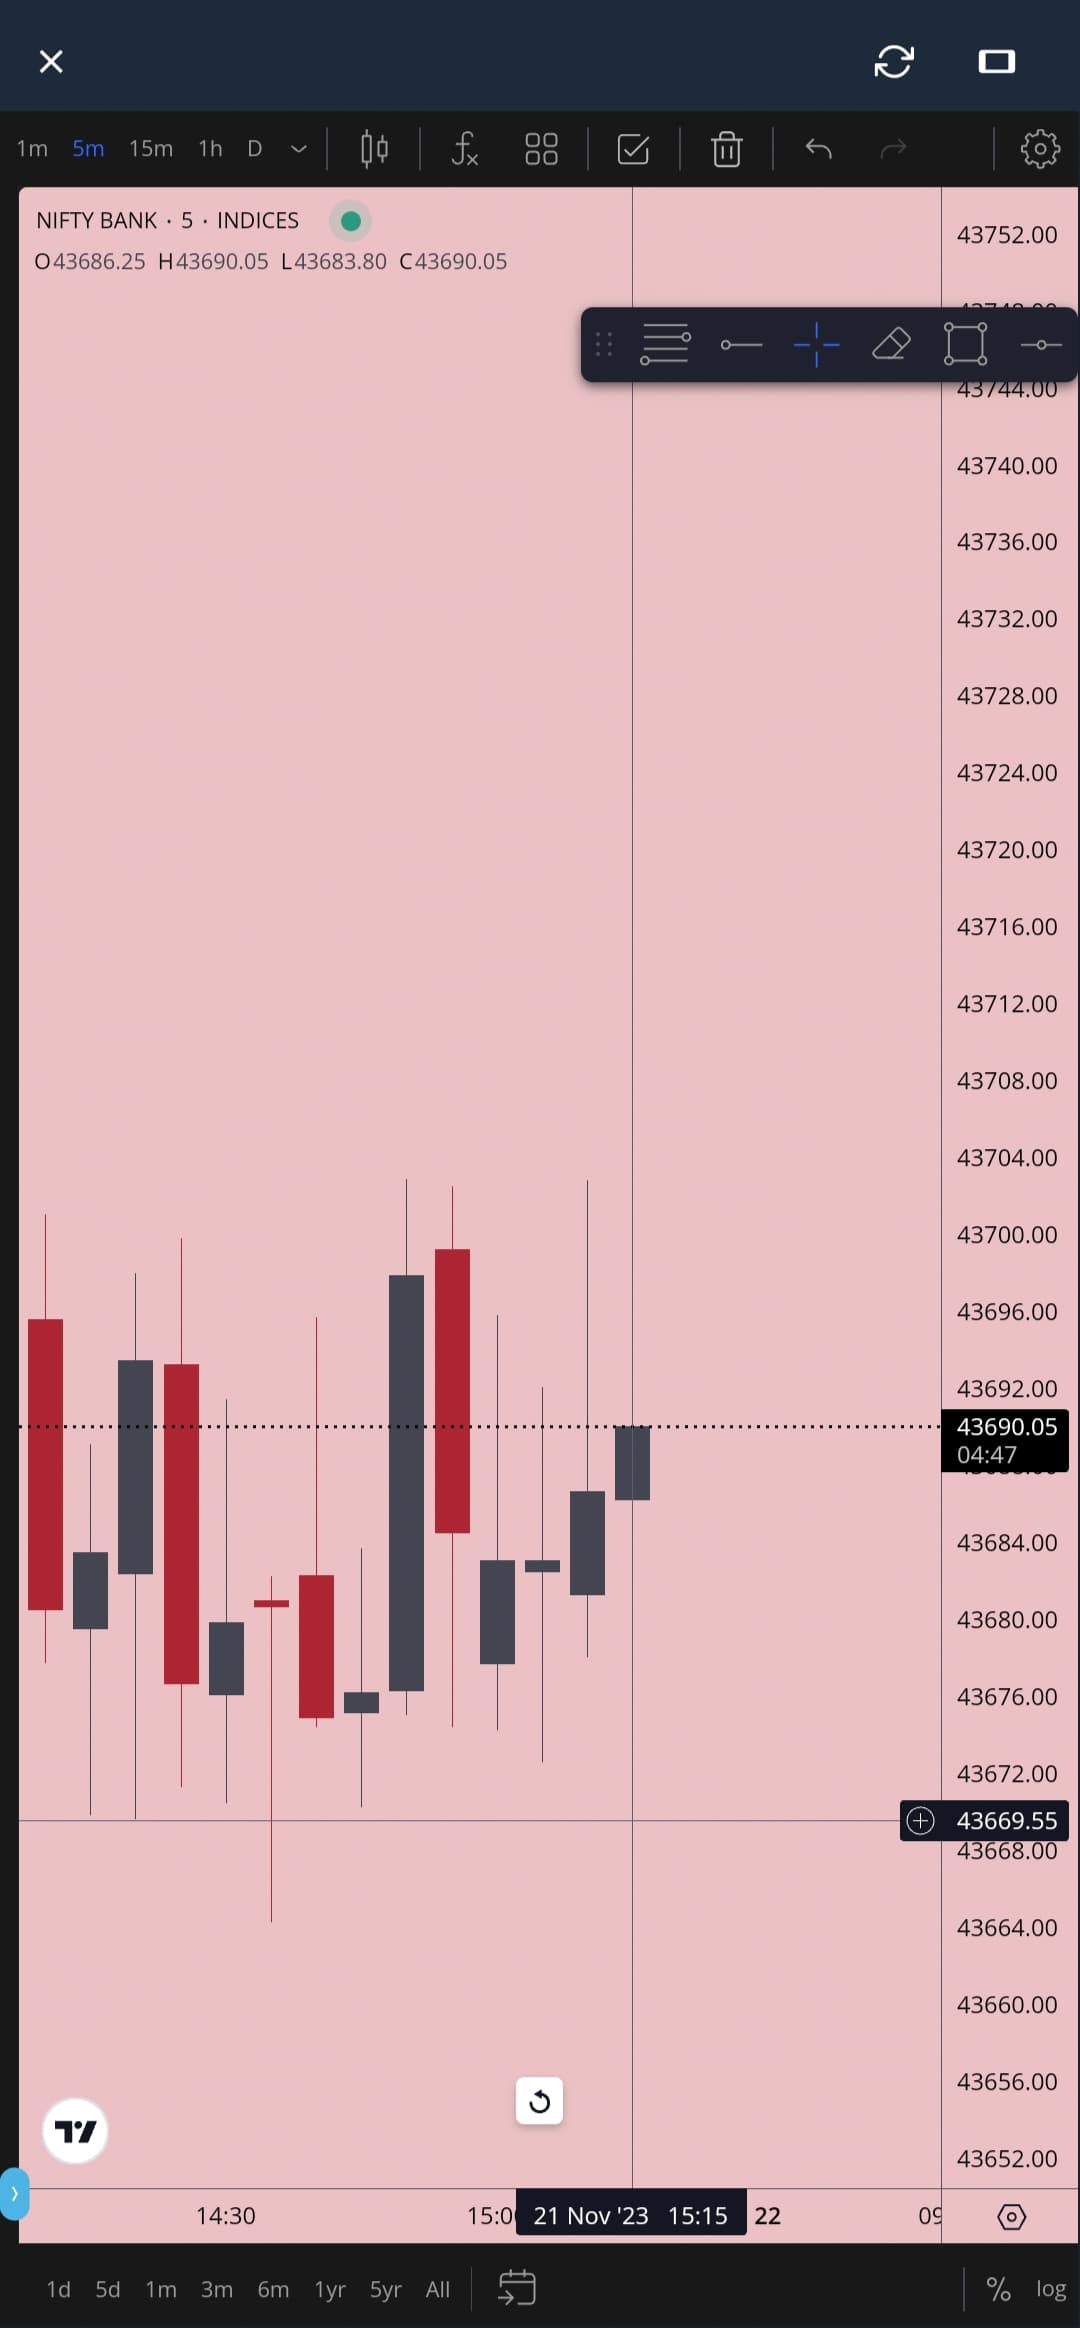
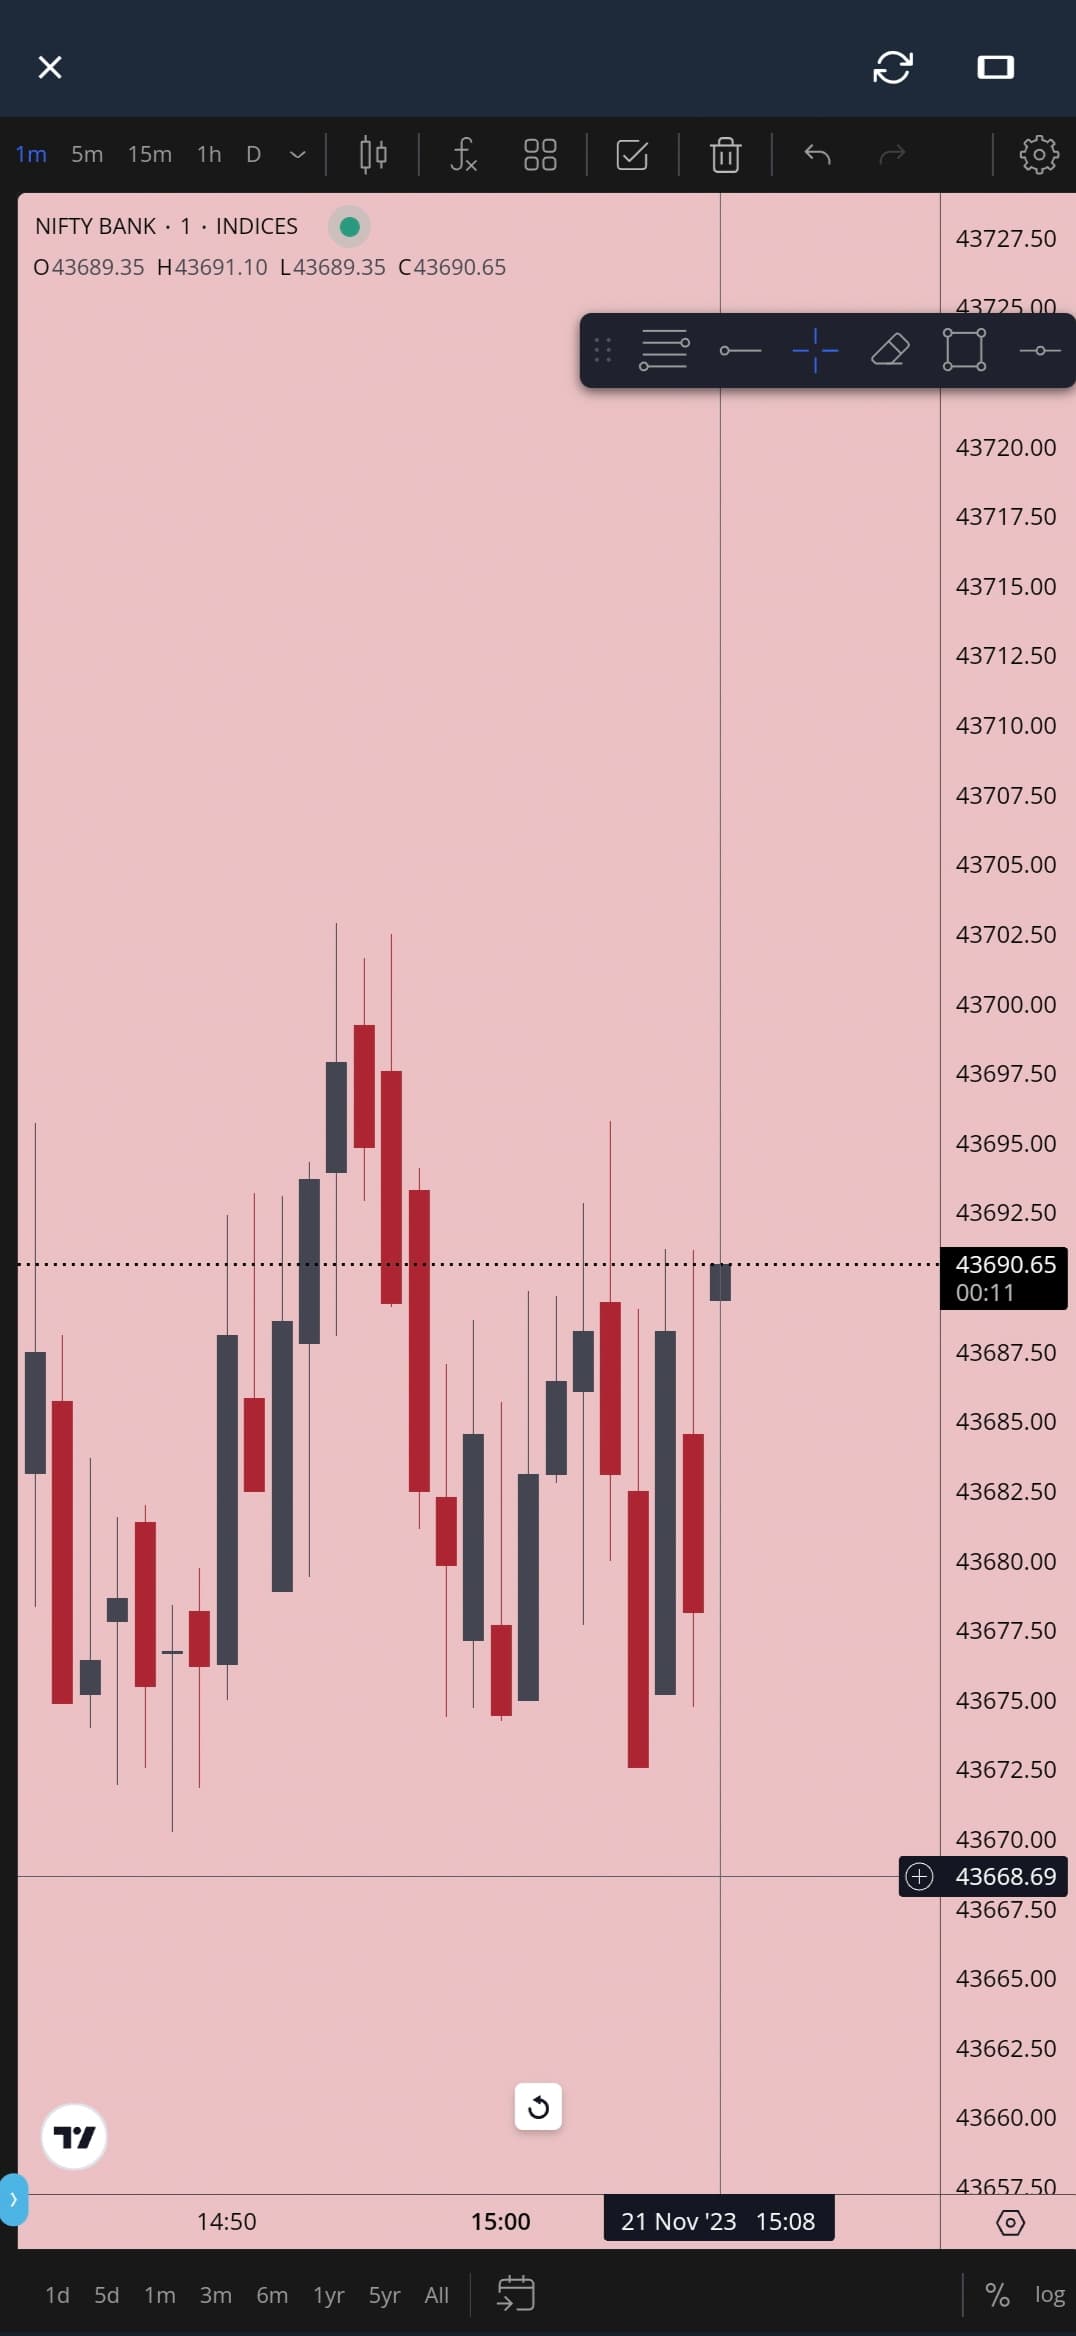
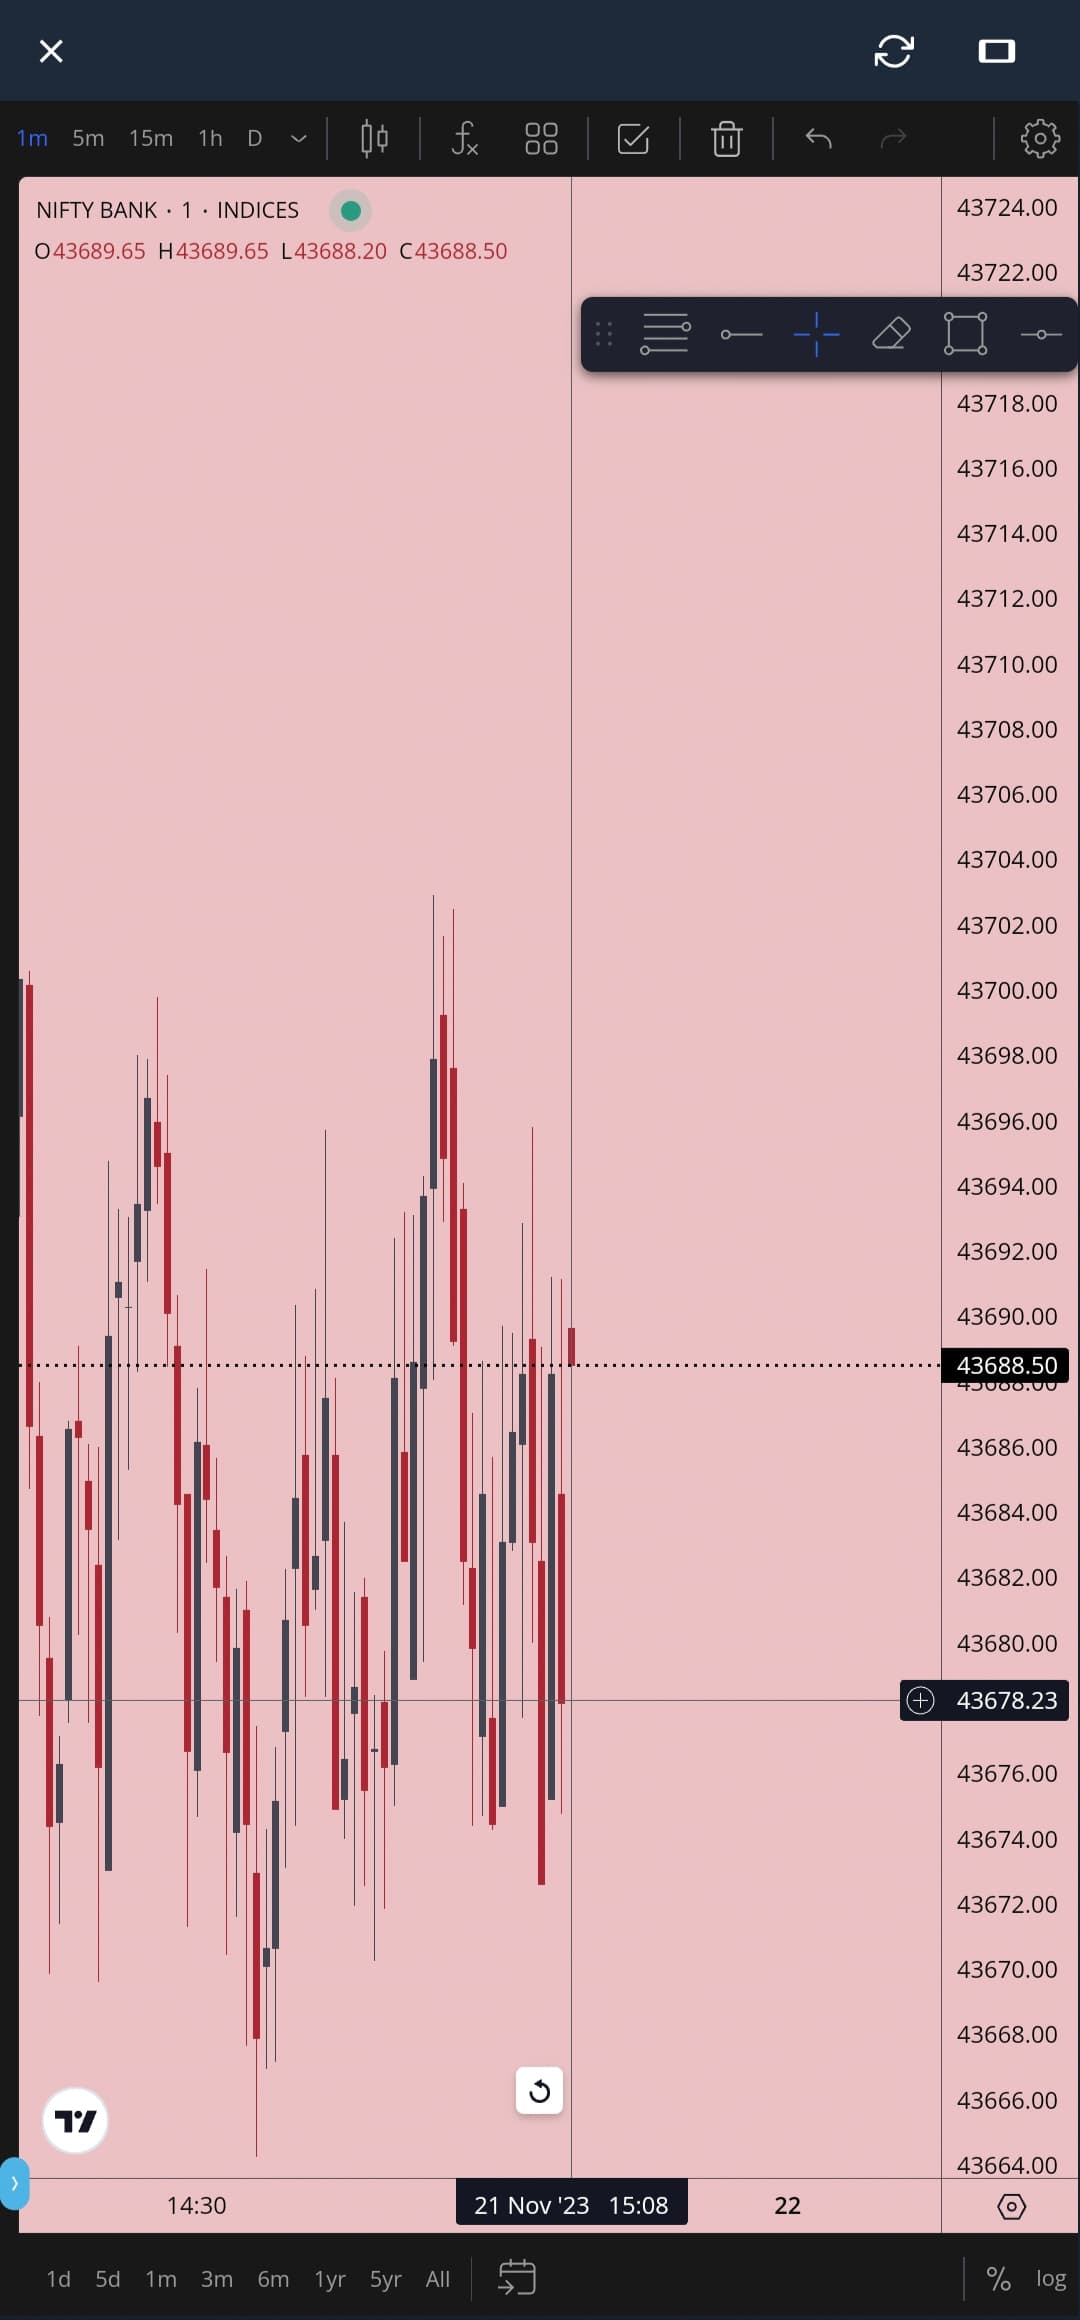
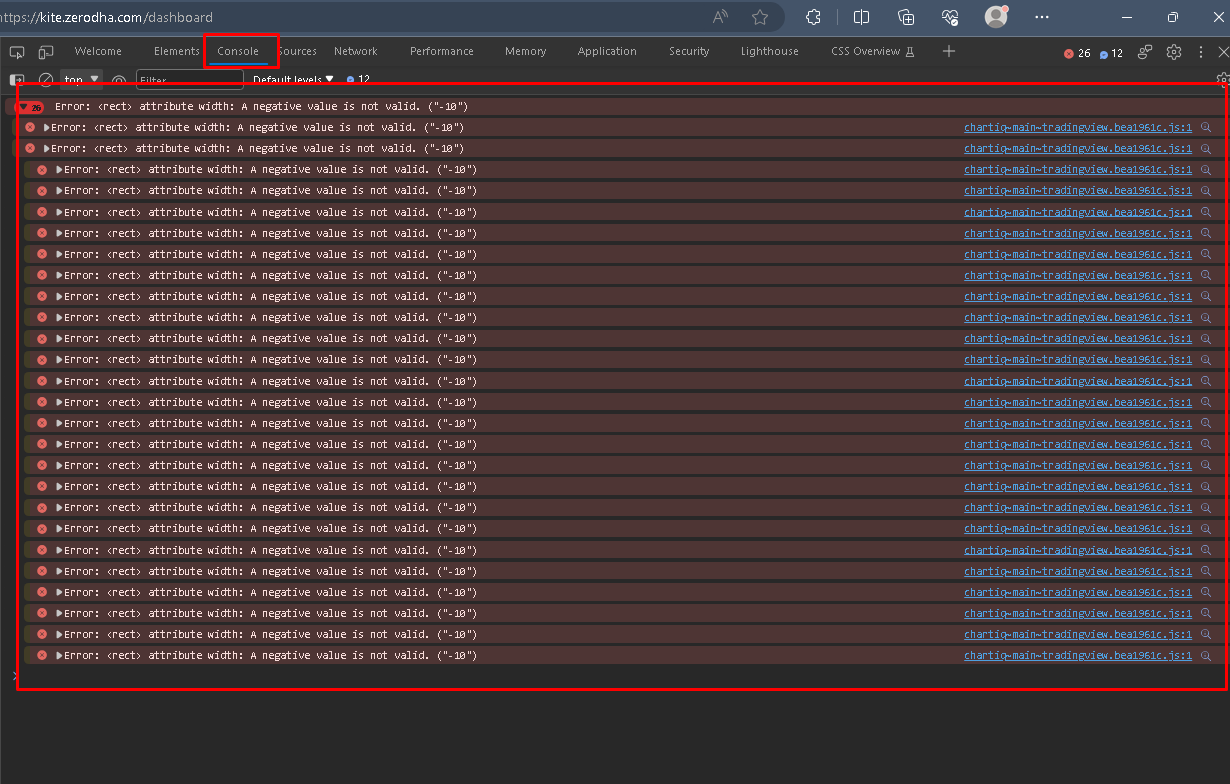
When we refresh the chart, a new open is created for the same minute candle.
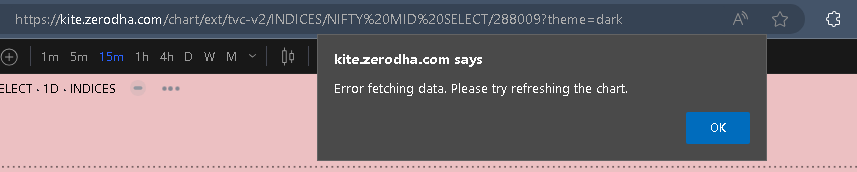
Since Nithin introduced the beta version, this issue has never been addressed. If I will raise the concern with the team via a ticket, their typical response will, ‘We are constantly improving our services,’ along with the suggestion to clear the cache. However, this solution doesn’t seem reliable in the long run.
When a chart is opened, live candles are formed on the user’s computer or mobile using the ticks or prices streamed from Zerodha’s end. Historical candles or the pre-existing candles on the chart are stored at Zerodha’s end using the market data received from exchanges. The data used to form candles on the user’s device could be a subset of the actual data received by Zerodha. This can happen due to variations in internet speed and uptime, resulting in the user receiving fewer ticks. Consequently, the candles plotted on the user’s device may slightly differ from the candles saved at Zerodha’s end for historical data. When the user refreshes the chart or opens a new one, Zerodha streams the historical candles, replacing the previously plotted candles from the time the chart was opened. This can lead to slight differences in how the chart appears upon refreshing or reopening the same chart. This is common across platforms.
Is the issue intermittent or consistent? Is there a pattern? Can you DM your client ID? We may need a few more details to address it.
Got it! I realize my previous responses may have been inappropriate. I apologize for mistakenly pointing out random errors and issues that weren’t actually present and for not identifying my own mistake earlier. I realize now that I might have been playing the blame game.
No need to worry about it. I am content with what I’ve received. Thank you, @nithin and @Arockiya_Raja, for your contributions to keeping the Zerodha trading community vibrant and active.