My first post on this forum, so if I violate any guidelines please point it out to me so that I can rectify it!!
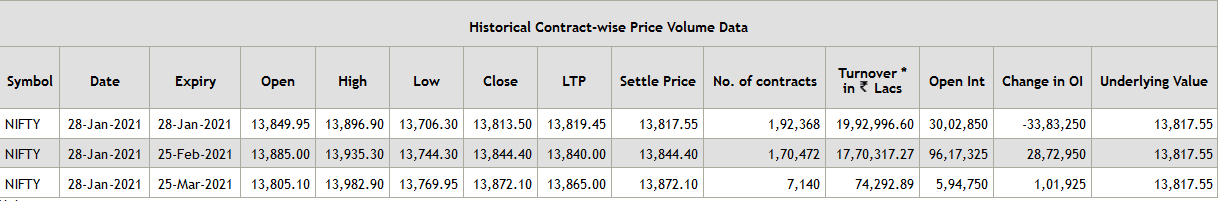
I know that the feature for continuous futures charts is already available for equity segment and I have already looked at the post created in this forum but I have a small doubt regarding the data displayed on the day of contract expiration. For example let us take the Nifty 50 Jan 2021 contract which expired on 28th Jan. However if you look at the data regarding the volume, on 28th Jan, both the Jan 2021 contract and Feb 2021 contract have significant volumes (Screenshot attached) and this I assume is because people are squaring off their trades or getting ready for final settlement or rolling their positions into the next month contract, so in this case which data is shown in the chart on 28th Jan 2021? Is it the Jan 2021 OHLC and volume data or Feb 2021 OHLC and volume data or some sort of weighted average of the two?