# RSI Calculation in excel
**URL:** https://tradingqna.com/t/rsi-calculation-in-excel/108935
**Category:** General
**Created:** [May 13, 2021, 5:30pm UTC](https://tradingqna.com/t/rsi-calculation-in-excel/108935 "2021-05-13T17:30:33Z")
**Posts on this page:** 9
**Page:** 1
### Author:  [@VP\_Srinivasan](https://tradingqna.com/u/VP_Srinivasan)
#### Post date: [May 13, 2021, 5:30pm UTC](https://tradingqna.com/t/rsi-calculation-in-excel/108935/1 "2021-05-13T17:30:33Z")
Hi All here,
I am trying to calculate RSI in excel based on the calculation given in Zerodha Varsity Technical Analysis book.
The result is different from Zerodha Kite’s RSI Value, Please help how to resolve this issue,
---
### Author:  [@siva-reddy](https://tradingqna.com/u/siva-reddy)
#### Post date: [May 15, 2021, 5:39pm UTC](https://tradingqna.com/t/rsi-calculation-in-excel/108935/2 "2021-05-15T17:39:32Z")
@AlgoGeek Can you.
---
### Author:  [@AlgoGeek](https://tradingqna.com/u/AlgoGeek)
#### Post date: [May 17, 2021, 4:32am UTC](https://tradingqna.com/t/rsi-calculation-in-excel/108935/3 "2021-05-17T04:32:56Z")
The formula for calculating the RSI value given in varsity & kite chartiq/tradingview is the same as given below.
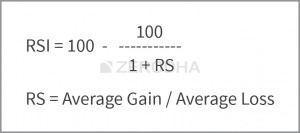
I have taken reliance 1-year daily OHLC data in excel and verified the RSI values, calculating with the above formula, It’s matching with kite tradingview/chartiq.
You can check this [google spreadsheet](https://docs.google.com/spreadsheets/d/1gSRLXmBKUoqTSuIvYj6akITUyYkBJWoufuaEQNFelw8/edit?usp=sharing) for your reference.
> **[RSI value](https://docs.google.com/spreadsheets/d/1gSRLXmBKUoqTSuIvYj6akITUyYkBJWoufuaEQNFelw8/edit?usp=sharing)**
>
> Sheet1
>
> Stock Reliance,daily data for 1 year
> RSI Formula,100 - 100/(1+RS),RS = avg gain / avg loss
> Date,OPEN,HIGH,LOW,CLOSE,GAIN,LOSS,AVG GAIN,AVG...
In varsity, the calculation is shown for the first RSI value with the simple average.
In excel calculation for RSI 14, we lookup avg of the first 14 gain/loss values and For the second RSI value we take( previous avg \* 13 + present avg gain/loss ) /14, this gives like smoothed average value.
---
### Author:  [@VP\_Srinivasan](https://tradingqna.com/u/VP_Srinivasan)
#### Post date: [May 17, 2021, 6:37am UTC](https://tradingqna.com/t/rsi-calculation-in-excel/108935/4 "2021-05-17T06:37:31Z")
Hi @AlgoGeek,
Thank you so much for the details response, this will help a lot.
if the second part of the calculation is updated in varsity book, it will be helpful to those who want to give a try. do you have any idea to whom we need to request it.
---
### Author:  [@siva-reddy](https://tradingqna.com/u/siva-reddy)
#### Post date: [May 17, 2021, 9:56am UTC](https://tradingqna.com/t/rsi-calculation-in-excel/108935/5 "2021-05-17T09:56:21Z")
> [@VP\_Srinivasan](#):
>
> if the second part of the calculation is updated in varsity book, it will be helpful to those who want to give a try. do you have any idea to whom we need to request it.
You can put it as comment on that varsity page itself.
---
### Author:  [@VP\_Srinivasan](https://tradingqna.com/u/VP_Srinivasan)
#### Post date: [May 17, 2021, 10:11am UTC](https://tradingqna.com/t/rsi-calculation-in-excel/108935/6 "2021-05-17T10:11:25Z")
Thank you so much…
---
### Author:  [@VP\_Srinivasan](https://tradingqna.com/u/VP_Srinivasan)
#### Post date: [May 22, 2021, 4:03pm UTC](https://tradingqna.com/t/rsi-calculation-in-excel/108935/7 "2021-05-22T16:03:32Z")
@siva-reddy, @AlgoGeek I just posted the solution, you have given for RSI problem in Varsity page.
Also updated my python program, now it works fine. Thanks for your help.
---
### Author:  [@tsachinsaini](https://tradingqna.com/u/tsachinsaini)
#### Post date: [March 4, 2025, 3:00am UTC](https://tradingqna.com/t/rsi-calculation-in-excel/108935/8 "2025-03-04T03:00:13Z")
Hi, I am also trying to calculate RSI 14 of RELIANCE as on 28th Feb and use same google sheet but RSI is not matching with Zerodha chart. As per google sheet calculation it is coming as 36.62 and in chart 36.23. also, is there any minimumn criteria limit for data to calculate RSI?
---
### Author:  [@nithin\_kumrr](https://tradingqna.com/u/nithin_kumrr)
#### Post date: [March 11, 2025, 6:04am UTC](https://tradingqna.com/t/rsi-calculation-in-excel/108935/9 "2025-03-11T06:04:34Z")
> [@tsachinsaini](#):
>
> I am also trying to calculate RSI 14 of RELIANCE as on 28th Feb and use same google sheet but RSI is not matching with Zerodha chart.
@tsachinsaini Hi Sachin, could yu try manual calculation again? You can follow it as explained here: [Indicators (Part 1) – Varsity by Zerodha](https://zerodha.com/varsity/chapter/indicators-part-1/#:~:text=14.1%20%E2%80%93%20Relative%20Strength%20Index)
Tradingview on 28th Feb: 36.23.

When manually calculating.
