Please provide me AFL for real time scanning of Buy or Sell Signals generated by Supertrend on stocks in time frame of 15 mins.
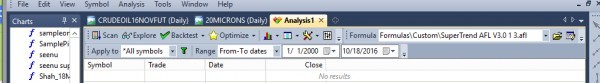
If you want to scan on real time in amibroker you have to load the below give super trend AFL in the scan under analysis as shown below screenshot
Check this Supertrend AFL
function GetSecondNum()
{
    Time = Now( 4 );
    Seconds = int( Time % 100 );
    Minutes = int( Time / 100 % 100 );
    Hours = int( Time / 10000 % 100 );
    SecondNum = int( Hours * 60 * 60 + Minutes * 60 + Seconds );
    return SecondNum;
}

function PopupWindowEx( popupID, bodytext, captiontext, timeout, left, top )
{
    displayText = bodytext + captiontext;
    if ( ( StaticVarGetText( "prevPopup" + popupID ) != displayText) OR ( StaticVarGet( "prevPopupTime" + popupID ) < GetSecondNum() ) )
    {
        StaticVarSetText( "prevPopup" + popupID, displayText);
        StaticVarSet( "prevPopupTime" + popupID, GetSecondNum() + timeout );
        PopupWindow( bodytext, Captiontext + popupID, timeout, Left, top );
        PlaySound("c:\\windows\\media\\ding.wav");
    }
}

_SECTION_BEGIN("SuperTrend Ver 3.0 with Sound and Popup Alert");
SetBarsRequired(100000,0);
GraphXSpace = 15;
SetChartOptions(0,chartShowArrows|chartShowDates);
SetChartBkColor(colorBlack);
GfxSetBkMode(0);
GfxSetOverlayMode(1);
SetBarFillColor(IIf(C>O,colorGreen,IIf(C<=O,colorRed,colorLightGrey)));
Plot(C,"\nPrice",IIf(C>O,colorDarkGreen,IIf(C<=O,colorDarkRed,colorLightGrey)),64,0,0,0,0);

// Initial Values overrides you backtesting settings

SetOption( "InitialEquity", 100000);
SetOption("FuturesMode" ,False);
SetOption("MinShares",1);
SetOption("CommissionMode",2);
SetOption("CommissionAmount",0);
SetOption("AccountMargin",100);
SetOption("RefreshWhenCompleted",True);
SetTradeDelays(0,0,0,0);
SetPositionSize(1,spsShares);

_N(Title = StrFormat("{{NAME}} - {{INTERVAL}} {{DATE}} Open %g, Hi %g, Lo %g, Close %g (%.1f%%) {{VALUES}}", O, H, L, C, SelectedValue( ROC( C, 1 ) ) ));

Factor=Param("Factor",4,1,10,0.1);

Pd=Param("ATR Periods",10,1,100,1);

Up=(H+L)/2+(Factor*ATR(Pd));

Dn=(H+L)/2-(Factor*ATR(Pd));

iATR=ATR(Pd);

TrendUp=TrendDown=Null;

trend[0]=1;

changeOfTrend=0;

flag=flagh=0;

for (i = 1; i <BarCount-1; i++) {

      TrendUp[i] = Null;

      TrendDown[i] = Null;

      trend[i]=1;

if (Close[i]>Up[i-1]) {

         trend[i]=1;

         if (trend[i-1] == -1) changeOfTrend = 1;

        }

      else if (Close[i]<Dn[i-1]) {

         trend[i]=-1;

         if (trend[i-1] == 1) changeOfTrend = 1;

      }

      else if (trend[i-1]==1) {

         trend[i]=1;

         changeOfTrend = 0;

      }

      else if (trend[i-1]==-1) {

         trend[i]=-1;

         changeOfTrend = 0;

      }

if (trend[i]<0 && trend[i-1]>0) {

         flag=1;

      }

      else {

         flag=0;

      }

if (trend[i]>0 && trend[i-1]<0) {

         flagh=1;

      }

      else {

         flagh=0;

      }

if (trend[i]>0 && Dn[i]<Dn[i-1]){

         Dn[i]=Dn[i-1];

		}

if (trend[i]<0 && Up[i]>Up[i-1])

        { Up[i]=Up[i-1];

		}

if (flag==1)

       {  Up[i]=(H[i]+L[i])/2+(Factor*iATR[i]);;

        }

      if (flagh==1)

        { Dn[i]=(H[i]+L[i])/2-(Factor*iATR[i]);;

         }

      if (trend[i]==1) {

         TrendUp[i]=Dn[i];

         if (changeOfTrend == 1) {

            TrendUp[i-1] = TrendDown[i-1];

            changeOfTrend = 0;

         }

      }

      else if (trend[i]==-1) {

         TrendDown[i]=Up[i];

         if (changeOfTrend == 1) {

            TrendDown[i-1] = TrendUp[i-1];

            changeOfTrend = 0;

         }

      }

   }

Plot(TrendUp,"Trend",colorGreen);

Plot(TrendDown,"Down",colorRed);

Buy = trend==1;

Sell=trend==-1;

Buy = Ref(Buy,-1);
Sell = Ref(Sell,-1);

GfxTextOut("Trend: "+WriteVal(Trend,1.2),500,500);

Buy=ExRem(Buy,Sell);

Sell=ExRem(Sell,Buy);

Short=Sell;

Cover=Buy;

BuyPrice=ValueWhen(Buy,C);

SellPrice=ValueWhen(Sell,C);

ShortPrice=ValueWhen(Short,C);

CoverPrice=ValueWhen(Cover,C);

Title = EncodeColor(colorWhite)+ "Super Trend AFL code " + " - " +  Name() + " - " + EncodeColor(colorRed)+ Interval(2) + EncodeColor(colorWhite) +

 "  - " + Date() +" - "+"\n" +EncodeColor(colorRed) +"Op-"+O+"  "+"Hi-"+H+"  "+"Lo-"+L+"  "+

"Cl-"+C+"  "+ "Vol= "+ WriteVal(V)+"\n"+

EncodeColor(colorLime)+

WriteIf (Buy , " GO LONG / Reverse Signal at "+C+"  ","")+

WriteIf (Sell , " EXIT LONG / Reverse Signal at "+C+"  ","")+"\n"+EncodeColor(colorYellow)+

WriteIf(Sell , "Total Profit/Loss for the Last Trade Rs."+(C-BuyPrice)+"","")+

WriteIf(Buy  , "Total Profit/Loss for the Last trade Rs."+(SellPrice-C)+"","");

PlotShapes(IIf(Buy, shapeSquare, shapeNone),colorGreen, 0, L, Offset=-40);

PlotShapes(IIf(Buy, shapeSquare, shapeNone),colorLime, 0,L, Offset=-50);
PlotShapes(IIf(Buy, shapeUpArrow, shapeNone),colorWhite, 0,L, Offset=-45);
PlotShapes(IIf(Short, shapeSquare, shapeNone),colorRed, 0, H, Offset=40);
PlotShapes(IIf(Short, shapeSquare, shapeNone),colorOrange, 0,H, Offset=50);
PlotShapes(IIf(Short, shapeDownArrow, shapeNone),colorWhite, 0,H, Offset=-45);

duration = 10000000;

LastClose= Ref(C,-1);  // if you like to add this popup will show you

if (Buy[BarCount-2]==True)
{
//PopupWindowEx( "ID:1", "Get Ready to BUY  \n"+Name() + "  "+ Interval(2)+" :  "+ " Last ="+LastClose  , "Buy Alert -", 1000, 100, 1 ) ;
}
if (Short[BarCount-2]==True)
{
//PopupWindowEx( "ID:2", "Get Ready to SHORT  \n"+Name() + "  "+ Interval(2) + "  :  "+ " Last ="+LastClose , "Short   Alert ", 1000, 1, 150 ) ;
}

TrendSL=IIf(trend==1,TrendUp,TrendDown);

for(i=BarCount-1;i>1;i--)

{

if(Buy[i] == 1)

{

entry = C[i];

sig = "BUY";

sl = TrendSL[i];

tar1 = entry + (entry * .0050);

tar2 = entry + (entry * .0092);

tar3 = entry + (entry * .0179);

bars = i;

i = 0;

}

if(Sell[i] == 1)

{

sig = "SELL";

entry = C[i];

sl = TrendSL[i];

tar1 = entry - (entry * .0050);

tar2 = entry - (entry * .0112);

tar3 = entry - (entry * .0212);

bars = i;

i = 0;

}

}

Offset = 20;

Clr = IIf(sig == "BUY", colorLime, colorRed);

ssl = IIf(bars == BarCount-1, TrendSL[BarCount-1], Ref(TrendSL, -1));

sl = ssl[BarCount-1];

Plot(LineArray(bars-Offset, tar1, BarCount, tar1,1), "", Clr, styleLine|styleDots, Null, Null, Offset);

Plot(LineArray(bars-Offset, tar2, BarCount, tar2,1), "", Clr, styleLine|styleDots, Null, Null, Offset);

Plot(LineArray(bars-Offset, tar3, BarCount, tar3,1), "", Clr, styleLine|styleDots, Null, Null, Offset);

//Plot(LineArray(bars-Offset, sl, BarCount, sl,1), "", colorDarkRed, styleLine|styleLine, Null, Null, Offset);

//Plot(LineArray(bars-Offset, entry, BarCount, entry,1), "", colorGreen, styleLine|styleLine, Null, Null, Offset);

/*

for (i=bars; i <BarCount;i++)

{

PlotText(""+sig+"@"+entry, BarCount-5,entry,Null,colorBlue);

PlotText("T1@"+tar1,BarCount-5,tar1,Null,Clr);PlotText("T2@"+tar2,BarCount-5,tar2,Null,Clr);PlotText ("T3@"+tar3,BarCount-5,tar3,Null,Clr);

}*/

messageboard = ParamToggle("Message Board","Show|Hide",1);

if (messageboard == 1 )

{

GfxSelectFont( "Tahoma", 13, 100 );

GfxSetBkMode( 1 );

GfxSetTextColor( colorWhite );

if ( sig =="BUY")

{

GfxSelectSolidBrush( colorBlue ); // this is the box background color

}

else

{

GfxSelectSolidBrush( colorRed ); // this is the box background color

}

pxHeight = Status( "pxchartheight" ) ;

xx = Status( "pxchartwidth");

Left = 1100;

width = 310;

x = 5;

x2 = 290;

y = pxHeight;

GfxSelectPen( colorGreen, 1); // broader color

GfxRoundRect( x, y - 98, x2, y , 7, 7 ) ;

GfxTextOut( ( " - Supertrend"),13,y-100);

GfxTextOut( (" "),27,y-100);

GfxTextOut( ("Last " + sig + " Signal came " + (BarCount-bars-1) * Interval()/60 + " mins ago"), 13, y-80) ; // The text format location

GfxTextOut( ("" + WriteIf(sig =="BUY",sig + " @ ",sig + " @") + " : " + entry), 13, y-60);

GfxTextOut( ("Trailing SL : " + Ref(TrendSL,-1) + " (" + WriteVal(IIf(sig == "SELL",entry-sl,sl-entry), 2.2) + ")"), 13, y-40);

/*GfxTextOut( ("TGT:1 : " + tar1), 13, y -80);

GfxTextOut( ("TGT:2 : " + tar2), 13,y-60);

GfxTextOut( ("TGT:3 : " + tar3), 13,y-40);*/

GfxTextOut( ("Current P/L : " + WriteVal(IIf(sig == "BUY",(C-entry),(entry-C)),2.2)), 13, y-22);;

}

// Calculate Equity Curve

eq = Equity( 1, 0 );

//////////////////////////////////////////////////
// Calculate the Last Five Trades Profit/Losses //
//////////////////////////////////////////////////

tradesback = 5;
Signum = Cum( Buy ) + Cum( Short );
Signumstart1 = LastValue( SigNum ) - ( tradesback - 1 );
Signumstart2 = LastValue( SigNum ) - ( tradesback - 2 );
Signumstart3 = LastValue( SigNum ) - ( tradesback - 3 );
Signumstart4 = LastValue( SigNum ) - ( tradesback - 4 );
Signumstart5 = LastValue( SigNum ) - ( tradesback - 5 );

bi = BarIndex();
bistart = ValueWhen( signum == signumstart1, bi );
bicond = bi >= bistart AND bi <= LastValue( bi );

SellPL = IIf( Sell AND bicond, C-BuyPrice, 0 );
CovPL = IIf( Cover AND bicond, ShortPrice - C,0 );

cumPL = SellPL + CovPL;

//Plot (SellPL,"Sell",colorGreen,styleHistogram,maskhistogram);
///Plot (CovPL,"Cover", colorRed,styleHistogram,maskhistogram);

lsince = LowestSince(Sell OR Cover, cumPL, 0);
hsince = HighestSince(Sell OR Cover, CumPL, 0);

vs= IIf(lsince==0,hsince,lsince);

PL1 = ValueWhen( signum == signumstart1 , vs,1 );
PL2 = ValueWhen( signum == signumstart2 , vs,1 );
PL3 = ValueWhen( signum == signumstart3 , vs,1 );
PL4 = ValueWhen( signum == signumstart4 , vs,1 );
PL5 = ValueWhen( signum == signumstart5,  vs ,1 );

//////////////////////////////////////////////////
//   Plot the Last Five Trades Profit/Losses    //
//////////////////////////////////////////////////

Title = EncodeColor(colorWhite)+ "Backtest Results  " + " - " +  Name() + " - " + EncodeColor(colorRed)+ Interval(2) + EncodeColor(colorWhite) +

 "  - " + Date() +" - "+"\n" +EncodeColor(colorRed) +"Op-"+O+"  "+"Hi-"+H+"  "+"Lo-"+L+"  "+

"Cl-"+C+"  "+ "Vol= "+ WriteVal(V)+"\n"+ EncodeColor(colorYellow)+ "\n\n\nLast 5 Trade Results\n" +
"\nTrade1= " + PL1
+"\n"+ "Trade2= " + PL2
+"\n"+ "Trade3= " + PL3
+"\n"+ "Trade4= " + PL4
+"\n"+ "Trade5= " + PL5;

//Magfied Market Price

FS=30;

GfxSelectFont("Times New Roman", FS, 700, True );

GfxSetBkMode( colorWhite );

GfxSetTextColor(colorGreen);

Hor=940;

Ver=12;

GfxTextOut(""+C, Hor , Ver );

YC=TimeFrameGetPrice("C",inDaily,-1);

DD=Prec(C-YC,2);

xx=Prec((DD/YC)*100,2);

GfxSelectFont("Times New Roman", 11, 700, True );

GfxSetBkMode( colorBlack );

GfxSetTextColor(colorYellow);

GfxTextOut(""+DD+"  ("+xx+"%)", Hor , Ver+45 );

_SECTION_END();

_SECTION_BEGIN("Time Left");

RequestTimedRefresh( 1 );

TimeFrame = Interval();

SecNumber = GetSecondNum();

Newperiod = SecNumber % TimeFrame == 0;

SecsLeft = SecNumber - int( SecNumber / TimeFrame ) * TimeFrame;

SecsToGo = TimeFrame - SecsLeft;

x=50;//Param("xposn",50,0,1000,1);

y=380;//Param("yposn",380,0,1000,1);

GfxSelectSolidBrush( ColorRGB( 230, 230, 230 ) );

GfxSelectPen( ColorRGB( 230, 230, 230 ), 2 );

if ( NewPeriod )

{

GfxSelectSolidBrush( colorYellow );

GfxSelectPen( colorYellow, 2 );

Say( "New period" );

}

//GfxRoundRect( x+45, y+40, x-3, y-2, 0, 0 );

//GfxSetBkMode(1);

GfxSelectFont( "Arial", 14, 700, False );

GfxSetTextColor( colorRed );

GfxTextOut( "Time Left :"+SecsToGo+"", x, y );

_SECTION_END();

_SECTION_END();
- How to set time frame for 15 minutes? means signals of buy or sell will generate according to 15 mins bars.
- Need a time stamp when the signal was generated.
Below error displayed while running SCAN in amibroker.
Variable “entry” used without having been initialized (Ln: 393, Col: 75)
Check again