I am new to trading and just completed Zerodha Varsity Module of Technical Analysis. I have tried to do some sort of technical analysis on those…Kindly suggest me regarding it.
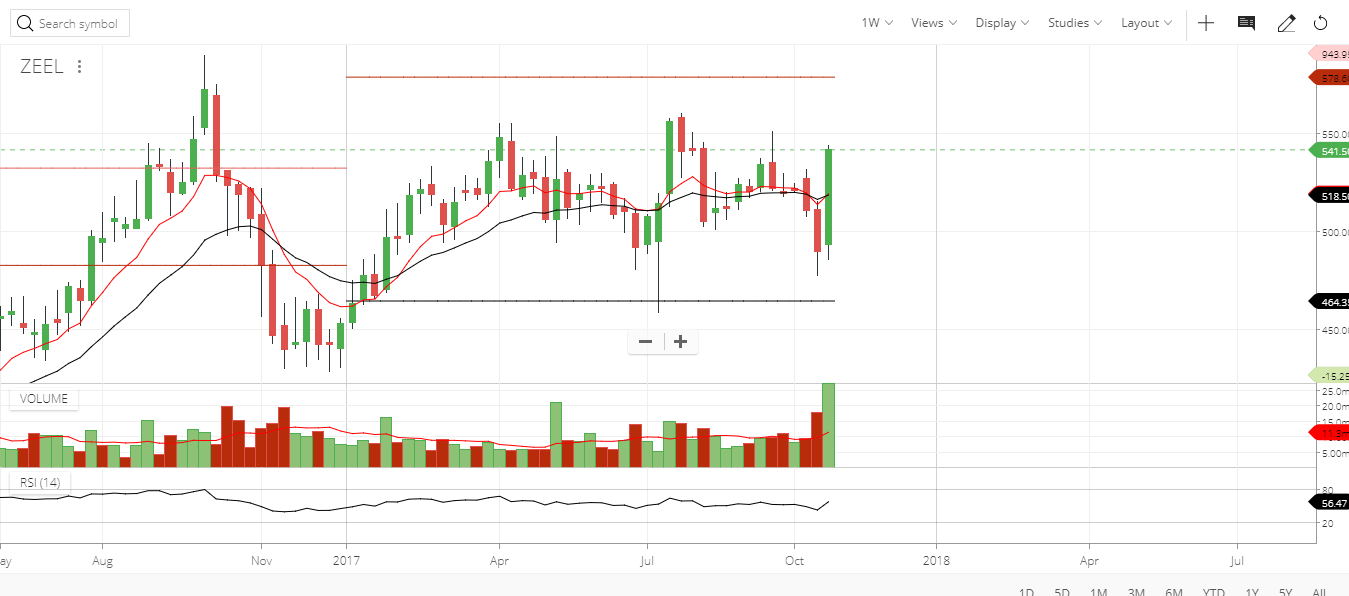
Its weekly chart OF ZEEL. It has Formed Bullish Engulfing pattern. Volume is good. We can see crossover of 9x21 on Monday. But the SL will be low of the pattern near the old resistance level of 490. Which i think is too deep.
What should i do? Should i Go long? All suggestions are welcome. Thanks in Advance
Zeel is in range of 490 to 550, very volatile stock, , Its pivot point is 529 long term charts are not encouraging & recent sharp move is not a sustainable one, better to wait and watch
A double top around 560 is clearly visible. You should wait for a close above that levels and If you are referring to last and second last candles then that is not bullish engulfing.
Technical analysis is as much a science as art .everybody’s opinion will differ, do what do feel like then you will learn, if u just listen to say even if a professional says buy and u buy and make money u wont learn anything, even if u sell know why u r selling, if u go wrong figure out where u went wrong. if u go long know exactly the factors, indicators that u r relying upon.