i use trading view charts regularly and my experience was good with it, but few recent incidents have changed my opinion about it, here is an example of a technical glitch in tradingview
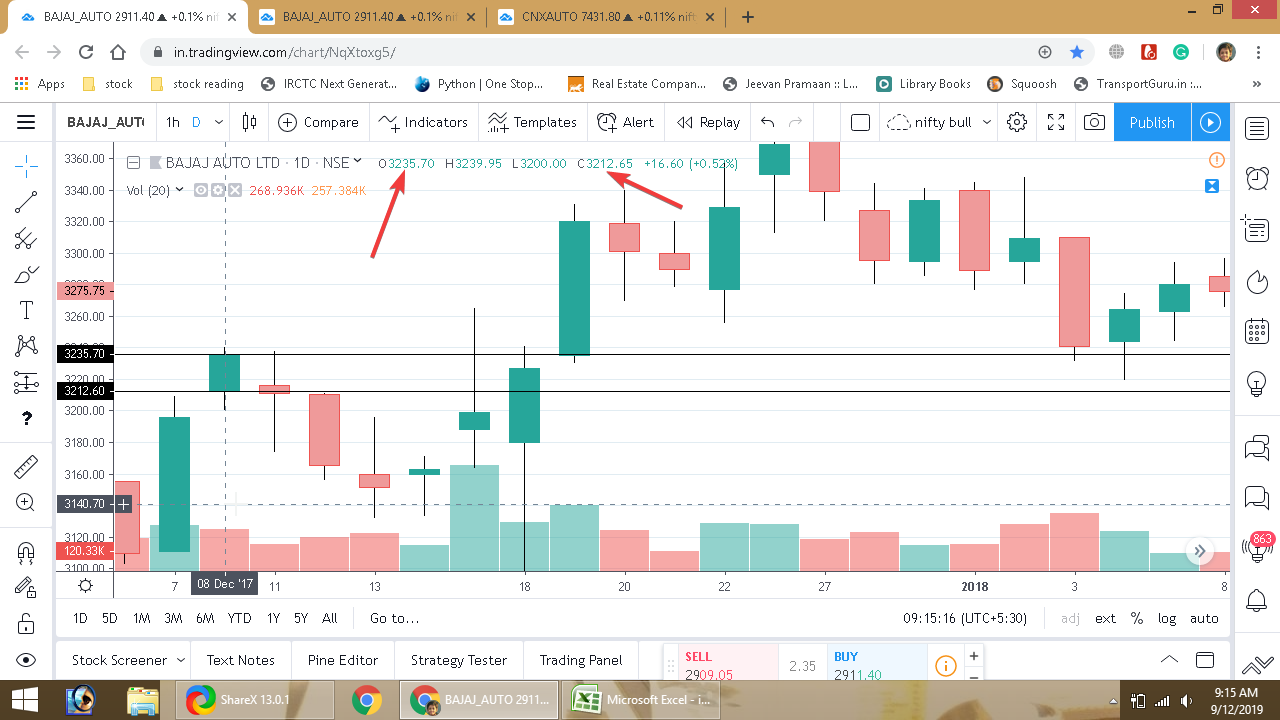
in the above daily chart of bajaj auto, you can see 8th of December candle prints open price of 3235.7 and close price of 3212.6, but it prints green candle on the chart.
then I checked it with zerodha kite,

you can see the difference. do you have any similar experience with tradingview charts?