Hello folks…
trying to understand what should be the right approach or what you guys usually do.
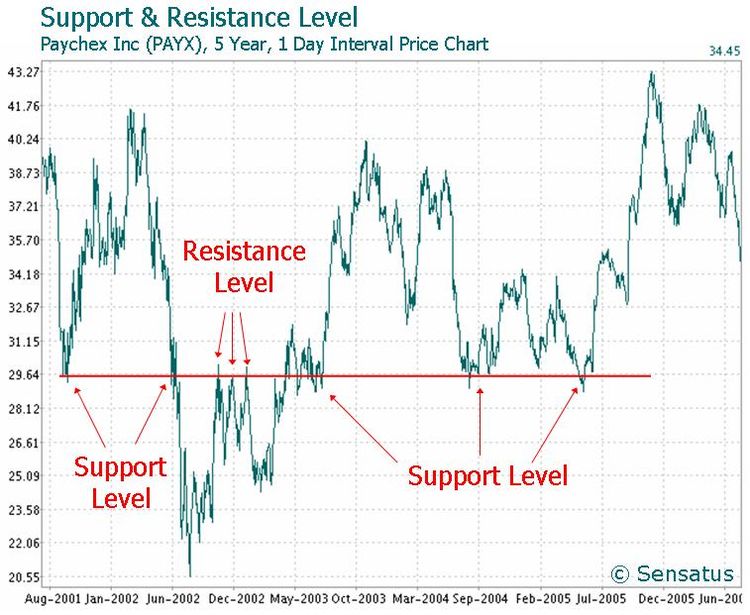
how do you decide which time frame to set for chart on screen to do S/R analysis or any other TA relevant analysis.? like, in the attached screenshot(shamelessly took it from Wikipedia), chart shows ‘Aug 2001’ to ‘June 2006’', what is the rational here.? if i choose different time frames(not talking about daily/1m/5m time frames of candles) sometimes support/resistance values vary or i may find different patterns which may change my initial view. whats the best way to decide this? i usually keep 6 months daily candles on screen. would like to know reasoning from your side and some tips on choosing right time set for analysis, if possible.
TA Learner here. I tried searching before posting, unfortunately couldn’t find any. Thanks in advance.