Trading strategies for consistent returns

I plan to publish simple but effective strategies for making trading simpler and profitable.

To start with, let us talk about a moving average crossover strategy. I know, I know, MA crossover strategies don’t work unless the market is trending, you get a lot of whipsaws, etc.are the arguments against this strategy, scaring away newbies from what could be a potentially very profitable strategy leading to great profits.

Here is my twist to this simple method for day trading:

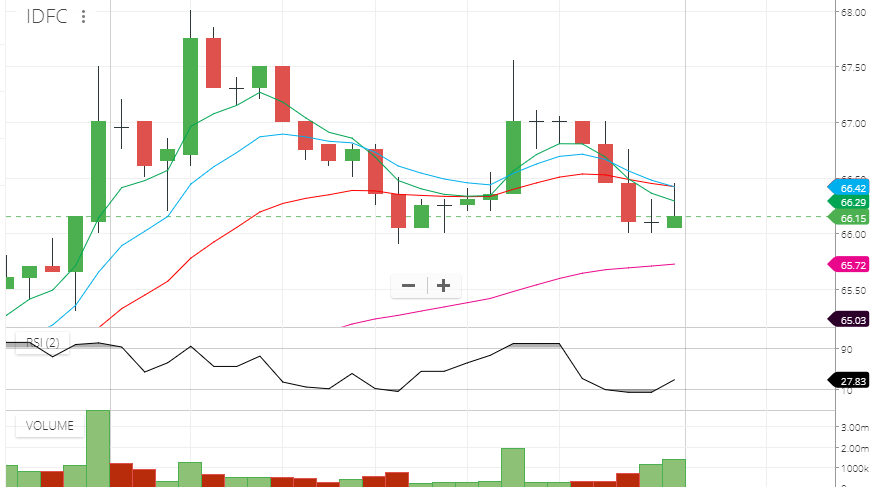
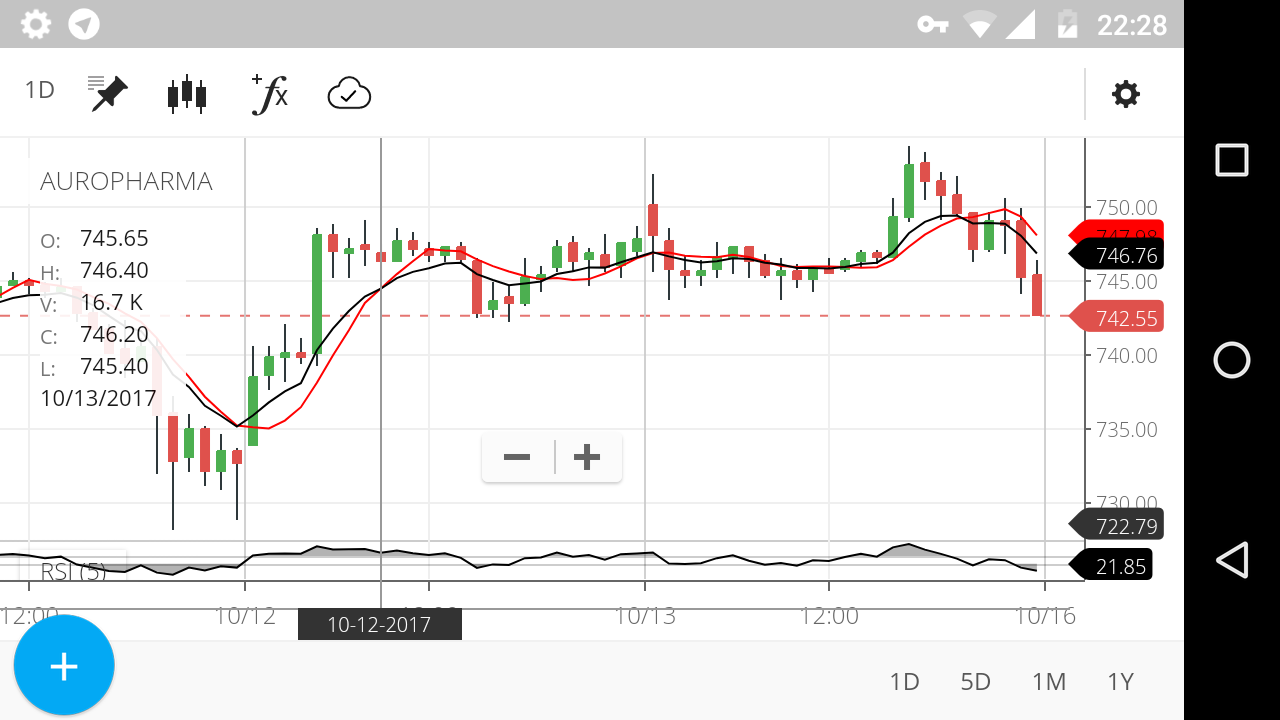
You wait for a crossover of a fast moving average over or below a slow moving average. When the crossover happens, you look at another indicator - RSI - with it’s settings modified as below:

RSI period is set to 5

Overbought and oversold levels are set at 60 and 40 respectively. However, we will use these levels as a filter for our trades based on the MA crossover.

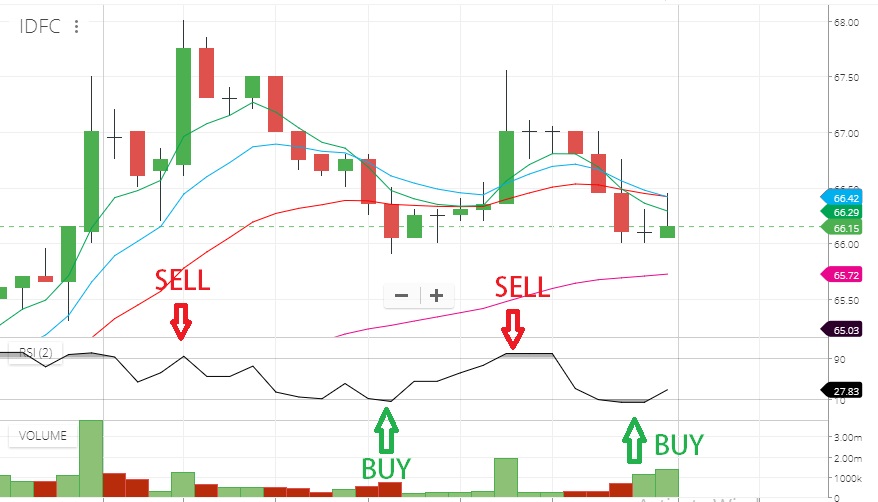
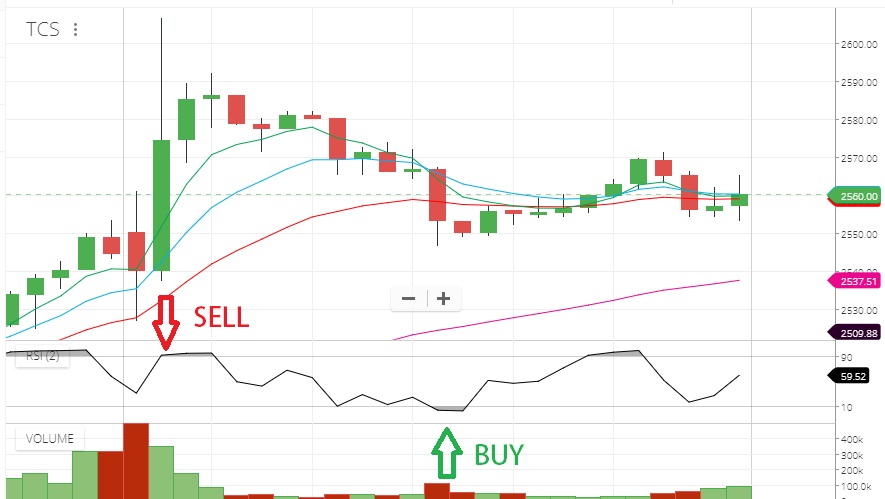
If RSI is above 60, we will take buy signals only.

If RSI is below 40, we will only take sell signals.

If RSI is between 40 and 60, we will avoid taking any buy or sell signals.

By following this simple filter, we are able to avoid the whipsaws to a great extent, and enter the right trends that could give us a profit.

What moving averages should I use?

You can use any combination of fast and slow moving average. I personally use 8 ema (fast), and 8 sma (slow).

Try this method, and I can assure you that you will be pleasantly surprised at how easy and profitable trading has become.

28 Likes

Can you explain a setup using a chart?

1 Like

TRY THIS RSI PERIOD SET TO 2.

SET TO Overbought 90 AND oversold 10.

If RSI is above 90, we will take SELL POSITION.

If RSI is below 10, we will only take BUY POSITION.

Now, This is Today CHART with These same settings in IDFC. (Only for Intraday)

11 Likes

I am afraid I don’t know how to upload a screenshot.

Tried for the first time.

See how RSI between 40 and 60 is indicating a sideways move. This is when we will avoid taking crossover signals.

You can try with other MA combos, say 8ema open and 8 ema close, etc.

3 Likes

No worries about the screenshot. It has come perfectly well. In the chart where is your buy/sell entry/setup?

Buy is when you get an ema crossover, and the RSI is above 60.

Sell is on crossover, with RSI falling below 60. ( Shaded areas on the RSI panel)

2 Likes

so we simply punch a market order?

I love this setting. It does get you in a bit earlier.

1 Like

Market order, SL-M, limit, whatever. Point is to get into the trade with the trend. Exit is of course your discretion. I usually set a small profit target and exit instead of waiting for another crossover.

1 Like

what would be the ideal time frame for intraday

I use 15 mins chart - I can’t react quickly enough with a 5.min chart.

4 Likes

CHART SETTINGS = 15 MIN
I Made it more easy to understand. (Only for Intraday) You have to be fast while Using these settings.

7 Likes

Thanks for adding one more arrow to my quiver.

where will uplace stop n tgt?


CHART SETTINGS = 15 MIN

RSI PERIOD SET TO 2.

SET TO Overbought 90 AND oversold 10.

If RSI is above 90, we will take SELL POSITION.

If RSI is below 10, we will only take BUY POSITION.

SAME SETTINGS ON TODAY TCS CHART.

8 Likes

@nvs74191: Thanks for your post sir. I will try this on Monday and get back to you about this strategy.

How to choose a stock for implementation of this strategy?

1 Like

You can choose any stock - ideally ones with large intraday price moves and highly volatile.

1 Like

Sure. Will be happy to have your feedback.

What is the role of ema here.
Entries are only based on rsi levels