Sure, i have manually refreshed one of the tabs now. Will check at 11:00 AM if new candle is formed and update.
Finally! Thank you!
It seems to be working fine now. The new candles are being formed.
Thanks for the quick response.
Hi,
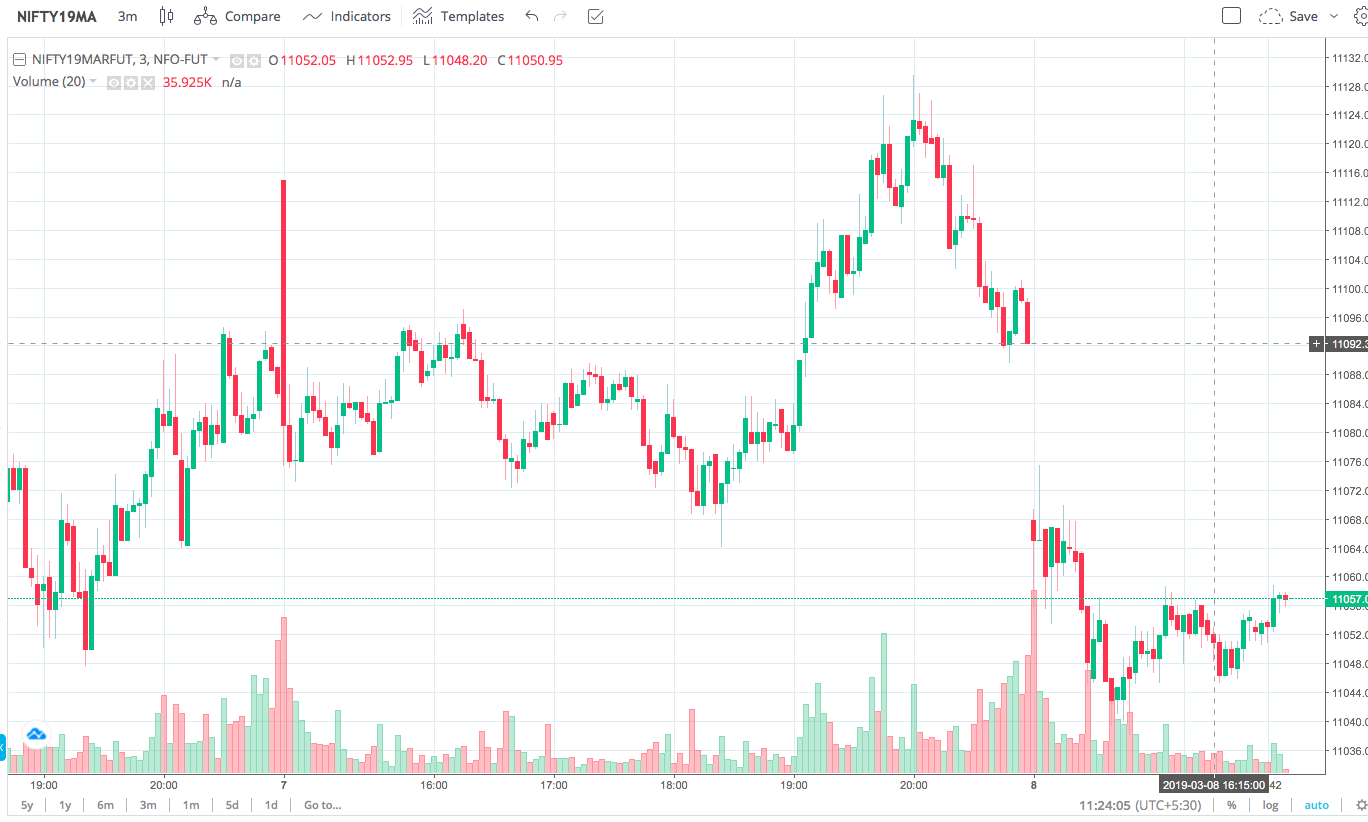
There is no new candle formed after I change the time frame unless I refresh the page. I am using Safari, Is there something with the browser I have to enable to make it live.
I am not sure if this is an issue on my end or a problem with the chart. Just needed a clarification.
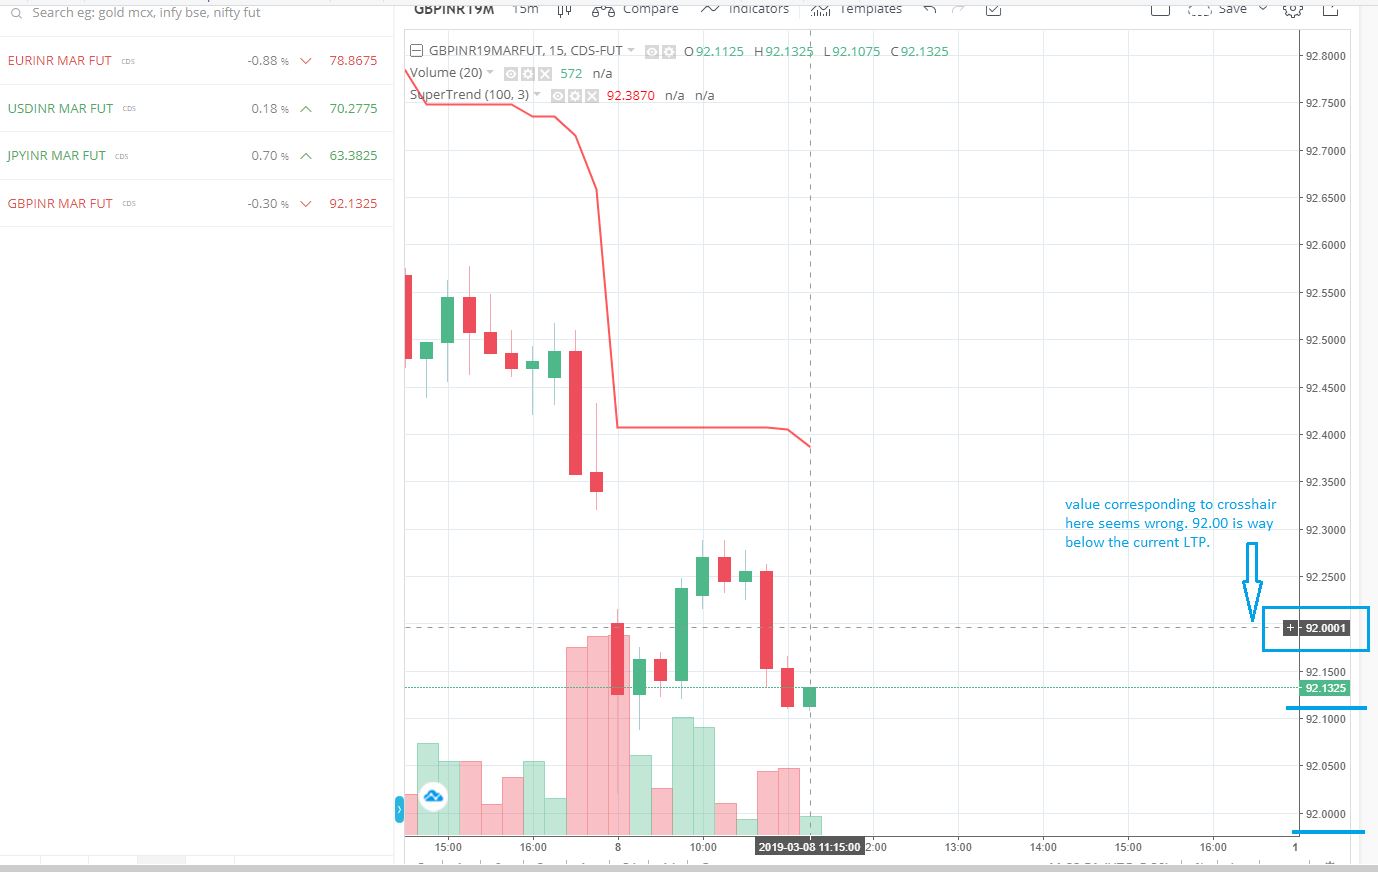
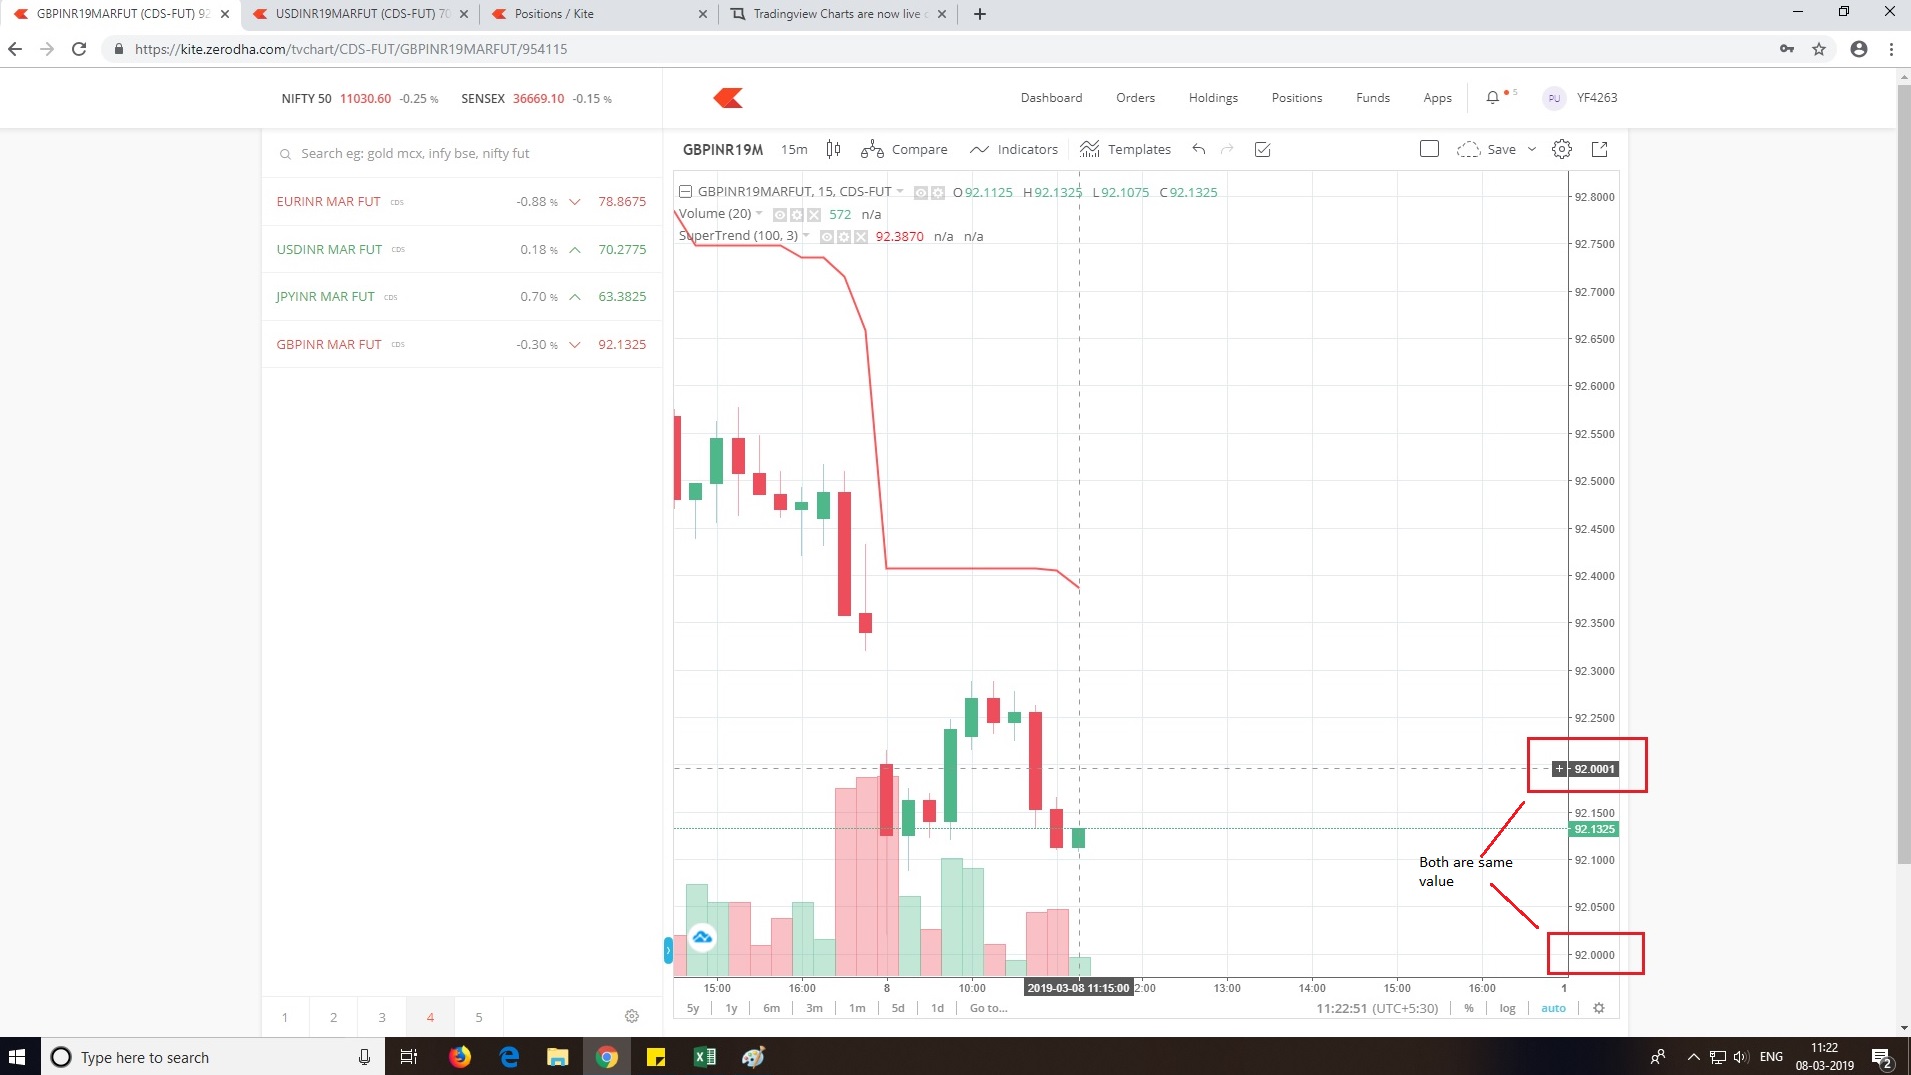
The values on the scale corresponding to the crosshair doesn’t seem to be showing the right values.
I made a small loss now because of this. Just took it for granted that the value as per the crosshair was right and placed SL there. But, in fact the price shown there was not right and my SL was hit.
The value shown here corresponding with the crosshair is 92.000, when actually that price is around 92.200
I have attached the screenshot below and highlighted the concern in blue.
@siva
Also, there still seems to be a problem with the candle formation. Facing the issue again.
I tried clearing the cache and restarting my browser. But hasn’t helped.
Can you check on other browser, checking on safari.
1 Like
Seems fine from our end, are you using safari browser?
Layouts are saved locally on one’s own system. So, this will happen.
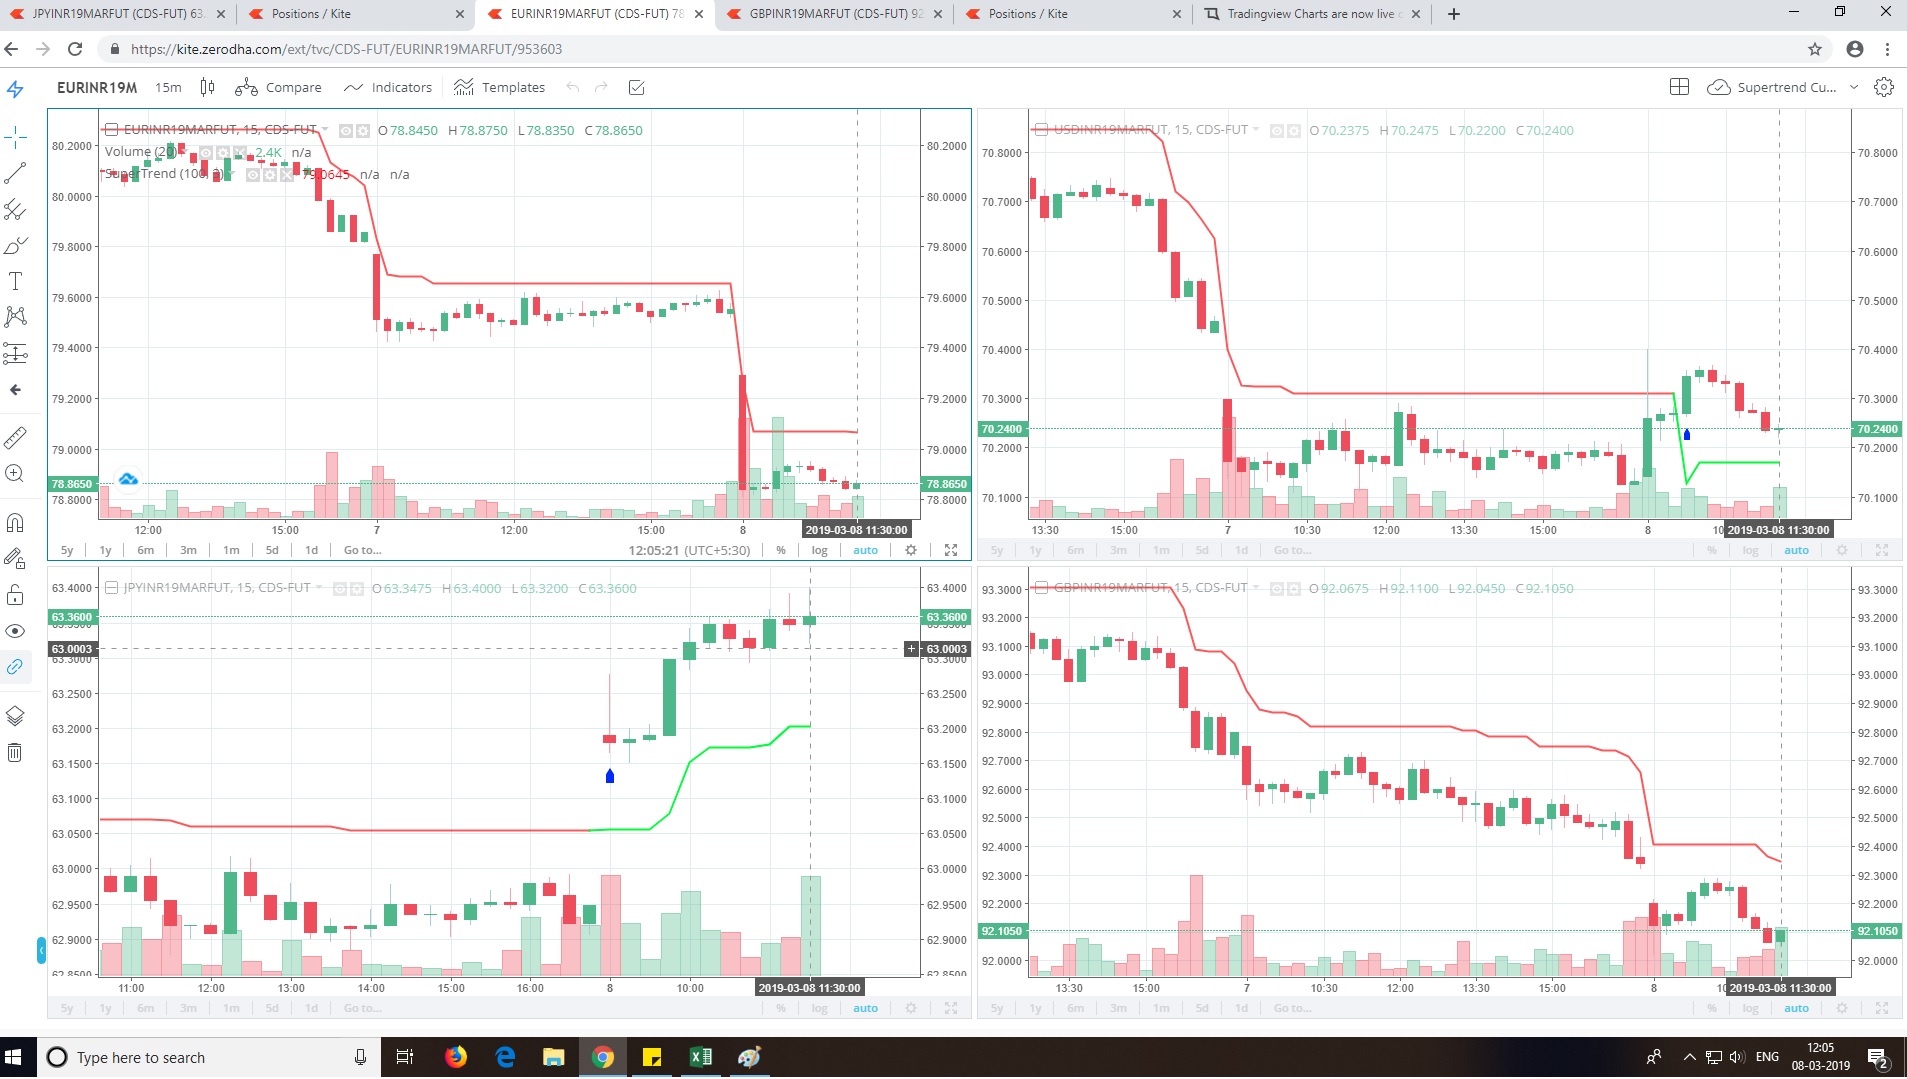
No, i am using Chrome. Please check below screenshot. The Last candle formed was at 11:30, nothing after that.
Also, could you please check this in case missed - crosshair issue
Candle formation issue:
Working fine on Chrome, I guess TV charts having an issue with Safari only. Please look into this
This is correct only, cross hair won’t show LTP, it will display that price where it is pointed.
Yes, but could you please check the screenshot that i had posted. The price pointed by the cross hair is showing as 92.00, but it should actually be 92.20
92.00 is at the bottom of the chart. I have attached below screenshot, might be more clear.
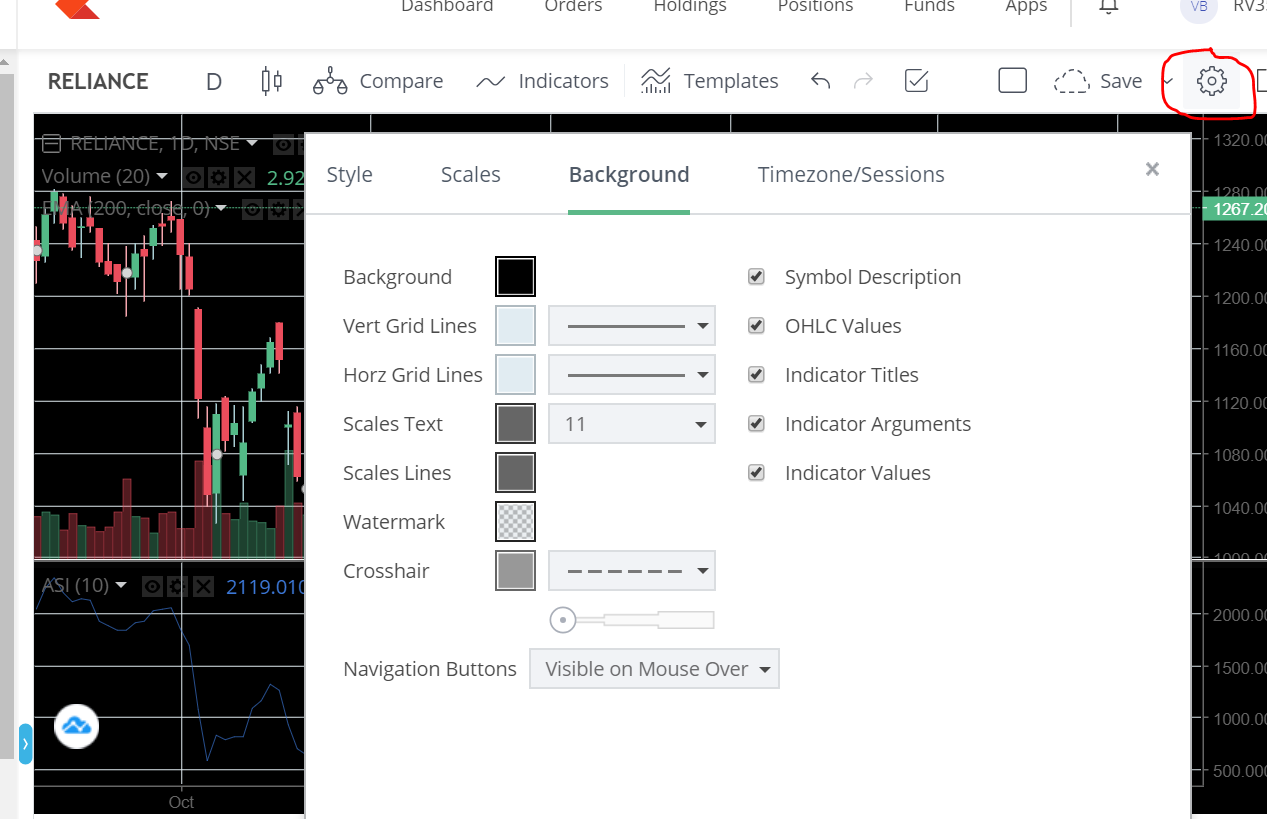
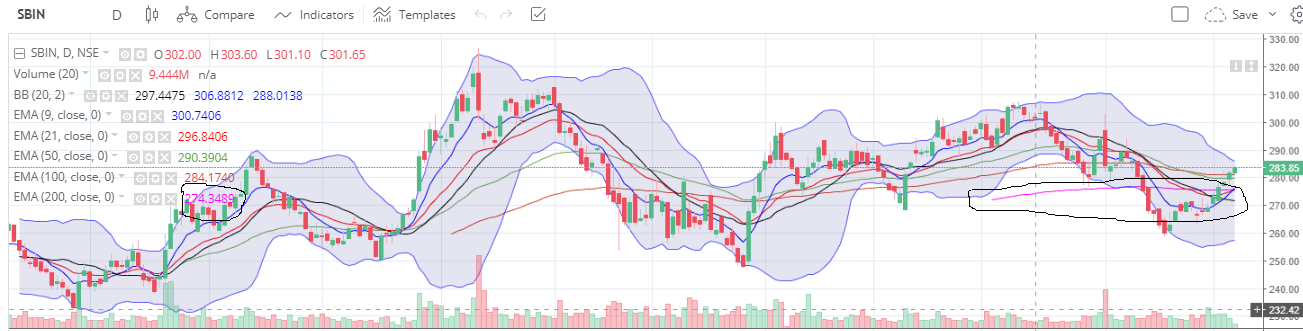
See in below chart 200DEMA is arount 274 when zoomed in and also see the 200DEMA line-its not complete.
Now See the below chart when we zoom out the 200DEMA is around 280 and the 200DEMA line is extended but still not complete.
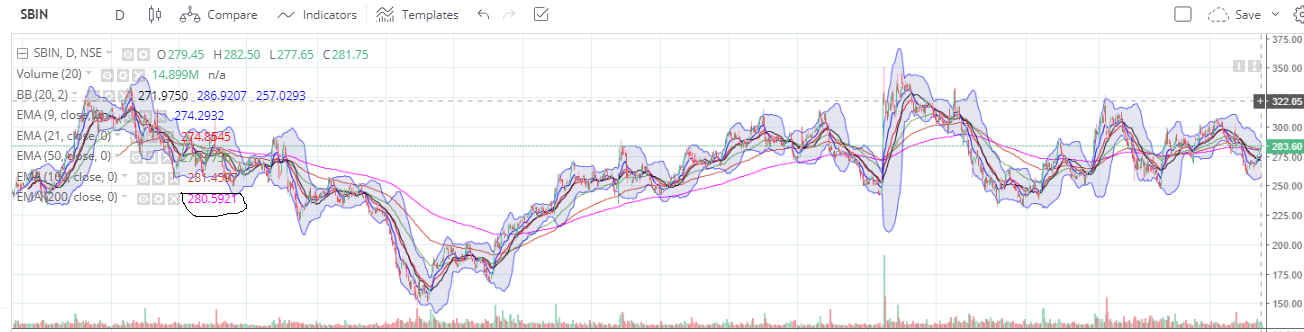
@siva please solve this problem.
@nithin Great job !! by you & team to implement TV charts. Many thanks. Can you pls do a favor…if you can kindly add 75min & 4 hour timeframe in charts? What about triggering buy/sell directly from charts?
Ya more data is needed to plot for higher averages, will check this.
Will add 2 in, 2 hour and 4 hour charts in coming weeks, trading from charts will take more time.