What is VWAP? How do I read this indicator?


I've been hearing a lot of buzz about this VWAP indicator and Zerodha has recently introduced this on Kite. How do I use  this indicator? 

3 Likes

HeLlO TrAdEr,

The vwap concept is that the price will eventually return to the VWAP line after a big up or down intraday move.

This could mean that by checking the vwap to ltp range on chart you can decide to sell at top or buy at bottom immediately after an intraday breakout.

In the attached image you can see the same theory in practice.

Interpreted similar to the Theory of Mean Revision "Mean reversion is the theory suggesting that prices and returns eventually move back toward the mean or average." 

1 Like

Hello!

VWAP stands for Volume Weighted Average Price.

VWAP gives us a more accurate average price as it considers the volume aspect of the scrip.
It is an intraday indicator and is used primarily by short term traders.

VWAP is calculated over the periodicity of the stock chart.
Lets select a 1 minute chart. VWAP is computed every 1 minute by considering the typical price and volume, 1 minute at a time.
Here, typical price(TP) is (High+Low+Close)/3 and  Volume(V) is the volume gained in 1 minute.

For 1 minute, we calculate TP x V(TPV). The cumulative TPV is arrived at by adding the TPV for all minutes as real-time data is being generated.
(In the Indian Markets, there are 375 trading minutes in a day(6.25 hours X 60 minutes). For a 1 minute chart, there will be 375 VWAP calculations and the 375th calculation will be the VWAP of the day.)

VWAP is then calculated as Cumulative TPV/Cumulative Volume.

VWAP provides us trading information on Range Bound Days and well as Trending days.


> On a Range Bound day, when the stock price crosses the VWAP line from below, it is used as a buy signal and when the price breaks the VWAP line from above, it is used as a sell signal.

> On a Trending day, it is quite the contrary. When the price reaches or slightly crosses the VWAP line from below, it is used as a sell signal and when the price reaches or slightly breaks the VWAP line from above, it is used as a buy signal.

The benefits of this indicator is a trader can wait for price patterns and movements around the VWAP line to take informed trading decisions.

a. On a downward trending day, he is assured to sell high and on an upward trending day, he is assured to buy low everytime the price tests the VWAP line​.
b. VWAP crossover reflects a shift in market sentiment on an intraday level, especially on range bound days.
c. As opposed to the fixed price Support and Resistance lines one derives from previous stock price data, VWAP provides us a more true and dynamic Support and Resistance line weighing in the factor of Volume in it as well.

Hope this helps, Cheers!


16 Likes

VWAP is one of the simplest indicators to use. It works on the principle of averaging the traded price in terms of the volume traded. Let me give you an example of to help you understand this better.

Here is how Infy traded between 14:30 and 14:35 on 2nd Nov 2016  –


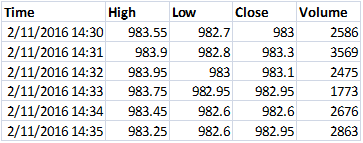
The data is quite simple to understand, for example, at 14:32, 2475 shares were traded, it made a high of 983.95, low of 983, and closed the minute at 983.1.

Now, we use this data and compute the VWAP price. In order to do this, we calculate the following –

1)  Typical price = which is the average price of High, Low, and close

2)  Volume Price (VP) = we get this by multiplying the typical price with its volume

3)  Total VP = This is a cumulative number, which is got by adding the current VP to the previous VP

4)  Total volume = This is again a cumulative number, which is got by adding the current volume to the previous volume

5)  VWAP = We get this VWAP number by dividing the Total VP by Total Volume. The resulting number indicates the average traded price, weighted by volume.

Let’s do the math on Infy data –


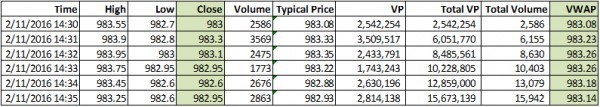
As you see, the VWAP is a dynamic number, changing based on how the trades flow in.

How to use the VWAP?

1)  VWAP is an intraday indicator, use it on minute charts. Often when you plot this, you will notice a jump at 9:15 AM, when compared to previous day’s data. Ignore this jump as it means nothing

2)  VWAP is an average and like any indicators employing averages, this too lags the current market price

3)   VWAP is used for 2 main reasons – to get a sense of intraday direction and to get a sense of the efficiency of order execution

4)   If the current price is below VWAP, then the general opinion is that the intraday trend is down

5)   If the current price is above VWAP, then the general opinion is that the stock is trending higher

6)   If the VWAP lies in between the high and low, then the expectation is that the stock will remain volatile

7)   If you intend to short a stock, then it is considered an efficient fill if you short the stock at a price higher than VWAP

8)   Likewise, if you intend to go long on a stock, then it is considered an efficient fill if you go long at a price lower than VWAP

On Kite:

Open the chart of your preference and select VWAP from the studies drop down –


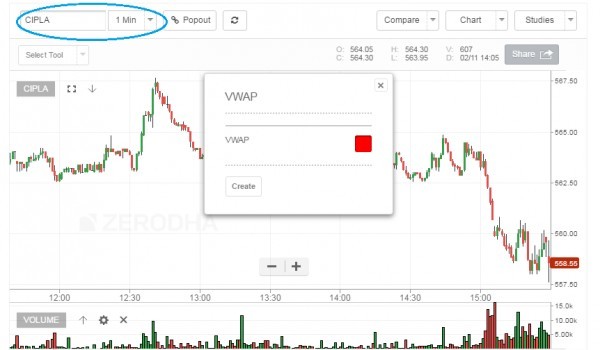
Note, VWAP can be applied only on intraday time frame and cannot be applied on EOD data.

Once you select the time frame (1 min, 5 mins, 10 mins etc), the engine calculates the VWAP and plots it on the chart as an overlay.


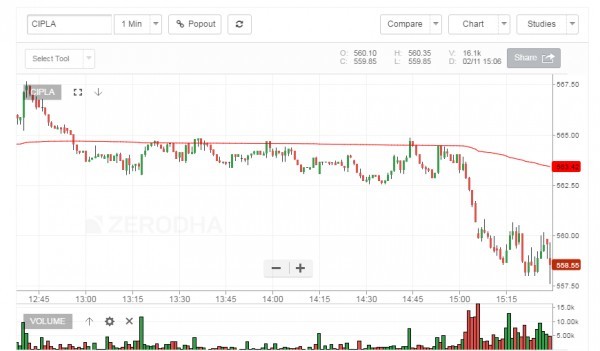
You can now visualize the VWAP and the current market price and plan your trades accordingly. 

Btw, if technical analysis interests you, check out Varsity

Good luck.

11 Likes

VWAP or Volume weighted average price is an indispensable tool for intraday traders to forecast the price move of stocks. It does not necessarily give trading signals but it helps in buying low and selling high. When used with other trading indicators it can definitely help in increasing the accuracy of your trading strategy. It is also used by large institutional investors or hedge funds to buy/sell at a point which would not cause sudden movement is stock prices.

Check out the below link to download a excel based VWAP trading startegy:

1 Like

not understood point no. 6, 7 & 8.
6) High & low of what ? Do you mean Day high & Day low? But VWAP will always remain in between. Another thing you said is , in such case stock will remain volatile…do you mean range bound or sideways?
7) & 8) has same doubt. When u say…if anyone wants to short a stock, he/she should intend to short well above VWAP. how that is possible in the above example of Cipla? Price is already trending downwards below VWAP.

Point 6 - If the VWAP value lies between the high price and low price of the stock, then it means the stock is just oscillating between these values, and not really trending in any particular direction
Point 7 & 8 - VWAP represents the general volume weighted average. An indicator of how the traders have traded the stock upto a certain point. Now, if you intend to short, clearly you will benefit if you can manage to short at a price higher than the general average price at which the stock has traded for the day. So you look for an opportunity when the stock trades above VWAP …that’s when you can decide to short. Likewise for a long trade.

1 Like

Thanks for the Post. What I see mostly is that VWAP Price is every time between day’s high and low’s in a normal mark unless there is sudden uptick or down tick. For e.g. YES BANK VWAP is 1522 and the Market Price is Rs.1526. Day’s Low is 1516 and High is 1531. Should I just sell it at 1526 and get it average to around VWAP level and purchase it around 1522 for Rs.4 per share profit. Is that how we read VWAP Price ?

How do we get this in Zerodha Pi??

VWAP is currently not available in Pi.

Can we code it and plot ???

1 Like

Sir,
Good evening,
I am reading varsity since 2/3 months.recently,i have opened my account with zerodha.put 22k in t/Ac.

     I am basically a small farmer,not familiar with chatting language  reading websites& asking and due to lack of practice .
                I am learning  slowly, if any trader may support me.
          I thanks zerodha and Mr.bhasker for joining me with all of you.
          Thank you very much sir.

Can Zerodha Folks, let us know when will this feature be incorporated in Pi?

It doesn’t work sometimes. But sometimes it does work. When there is trend reversal it doesn’t work at all.

Really nice explanation, Karthik. Thank you.