Bulls were on the dominating side (Bull run is quite visible)
Buildup happening at the resistance, that too upward-moving.
The breakout happened, I made an entry on the call side but the market turned down.
Just curious to understand whether I was wrong anywhere or it is one of those losing trades despite good logic.
remember , there is always a chance the breakout can fail. After every consolidation market tries to breakout but fails. markets cannot keep breaking out successfully after every consolidation. if it did we would have endless trend. wouldn’t that be nice. but the reality is otherwise.
In this setup, after the breakout from the triangle, price action failed to follow through. dull price action after the candle that you have marked with the arrow.
depending on where your stop was, you could have reduced your risk seeing that there was no follow through and taken a small loss.
Yes, after I saw those weak candles after the breakout I squared off my positions with 2 pips of loss. Thank you, much appreciated I’ve always needed some good people in the group to discuss my trades, none of my friends and family are into this. Hoping to hear from you again soon!
Only question is - if you take 1000+ ‘such’ trades with your trade management and position sizing rules, does it make good money ? You have to test this yourself. No substitute for that.
Any single pattern can do anything. Different people have different ways of looking at things, i don’t think any individual info such as SR on HTF or something else has actionable use for you - until you test it out.
fwiw, pattern looks ok to me. Breakouts/momentum is not doing well for some time now in intraday. In another environment, this might have worked out.
though one can argue that patterns are pointless but only at individual level, “beacuse of masses it falls true” otherwise it’s dim reflection of demand & supply zone
People use higher time frame because it shows bigger picture otherwise it’s cluttered in shorter tf
like in the case of HDFC life today I’d be more cynical to take positive trade, infact wouldn’t even short it even though it was perfect setup beacuse trend is what i stick by
yes, both ways it can work. I can look at just the 5m chart and trade or i can look at multiple TFs, Later one perhaps depends more on discretion. I have done both ways and both are fine.
But what matters is that everyone needs to test it (whatever rule) out on his own and add complexity only when it makes a reasonable difference. Simple things work too.
See that one big steep short candle, its most likely due to news events. For some reason when main significant news events comes up ,technical analysis doesn’t work properly. What day was this ? was it yesterday after nasdaq took a hit and that shock wave travelled all over global markets?
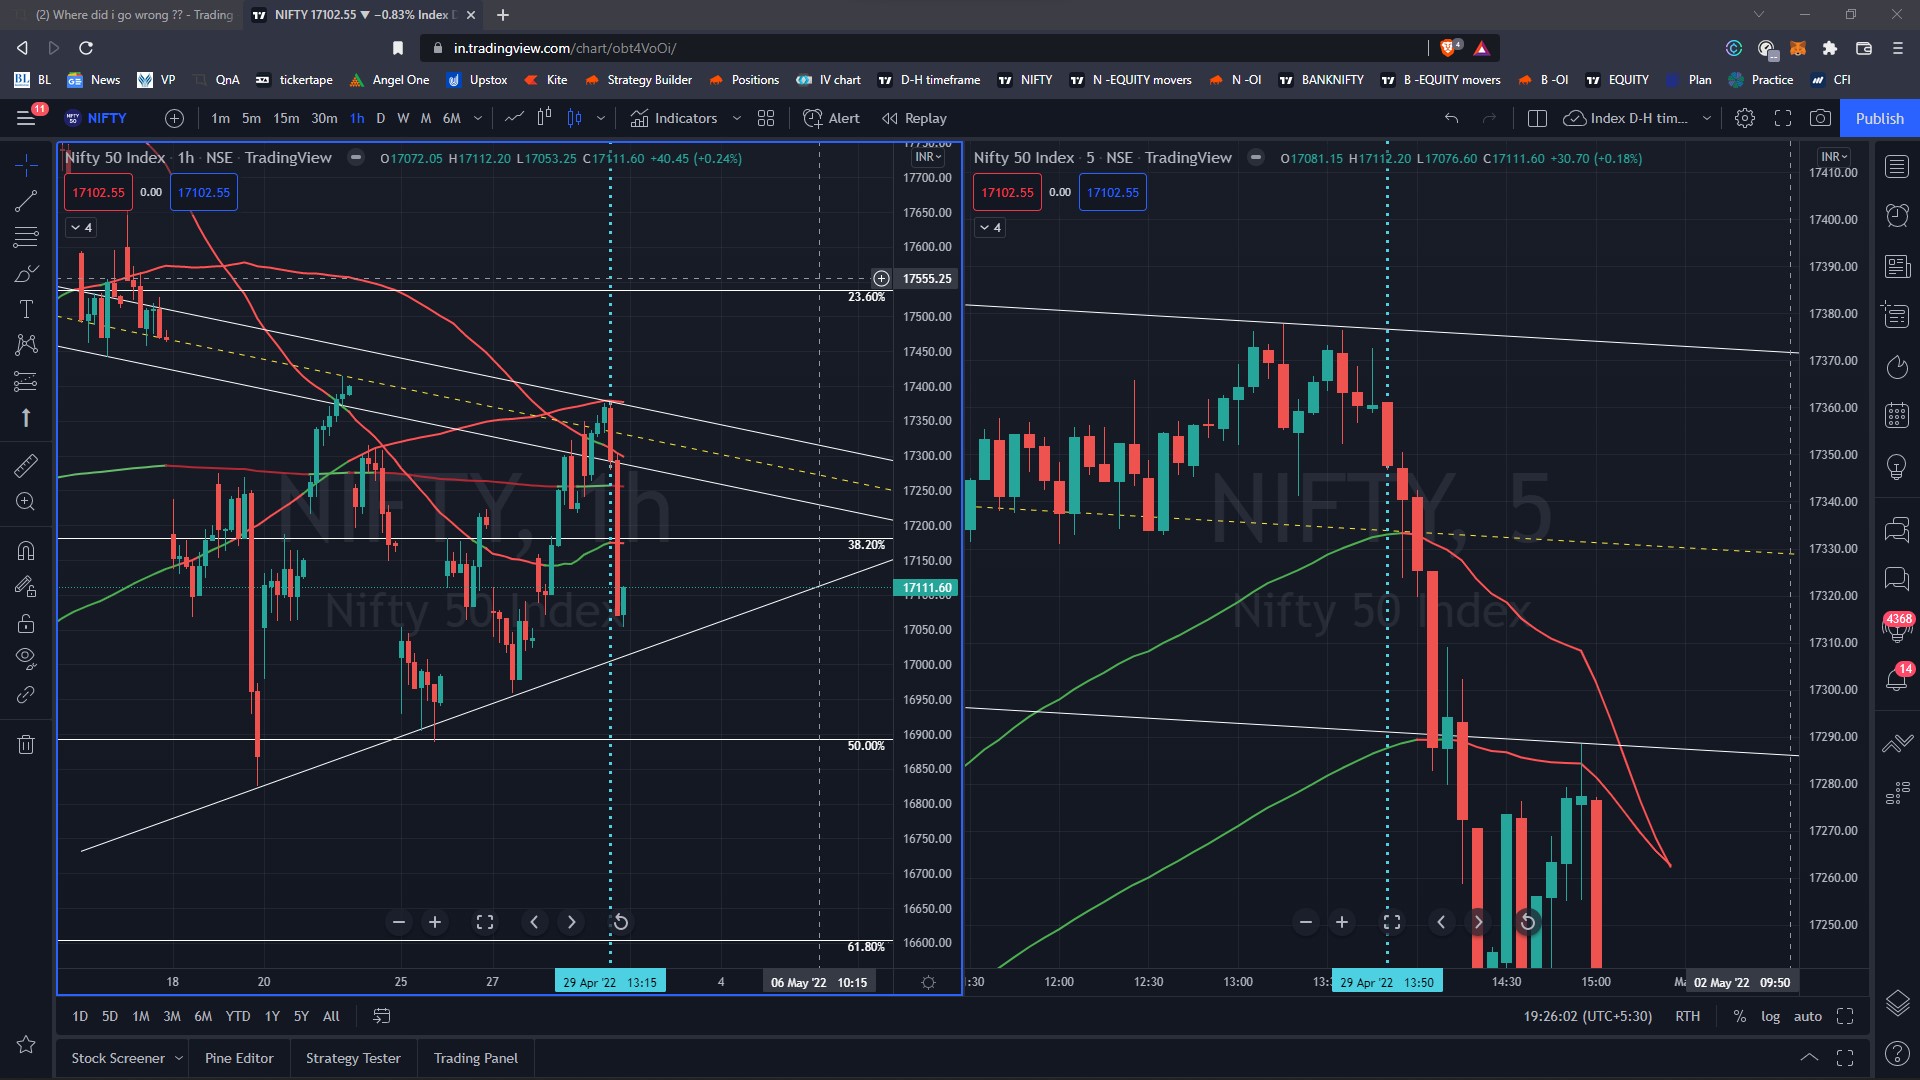
IN 5 min. chart pattern of NIFTY 50 & HDFC Life => At 13:45 you saw shooting star formation in both NIFTY50 and HDFC Life.
IN 1 Hour chart pattern of NIFTY 50 => At the top of a symmetric triangle formation. Followed by a over-head resistance of 200 SMA. Showcasing a good probability of bearishness in the overall market.
Ideally it is not a good idea to take a bullish breakout trade while the markets are showing bearish sentiments.
Unless and until you have insider info or great earnings result.
Following Learnings => Take Breakout patterns in sink with the market
Whoops! I saw the time but didn’t see the date. From charts I can see that price was consolidating today since market open but exactly at 1pm markets fell like anything. I checked the nifty history today too and the time matches. Nifty and sensex are both down. I think the substantial scare from Nasdaq , rising 30 year treasury yeilds combined with poor Q4 results of companies which must have been released today and must have led scare among investors that they must have pulled out from equity to cause this short. Today is 29th April afterall. Check for any news event. I only know Q4 results were released
Your logic was correct, it was continuously hitting resistance making it weak. But you should have checked previous days movement also. The stock has been continuously in uptrend since 27th April.
Think like this → people who had purchased the stock on 27 th & 28 th would see good MTM profits in the short term. So most likely, profit booking is ought to happen and most likely the breakout would fail.