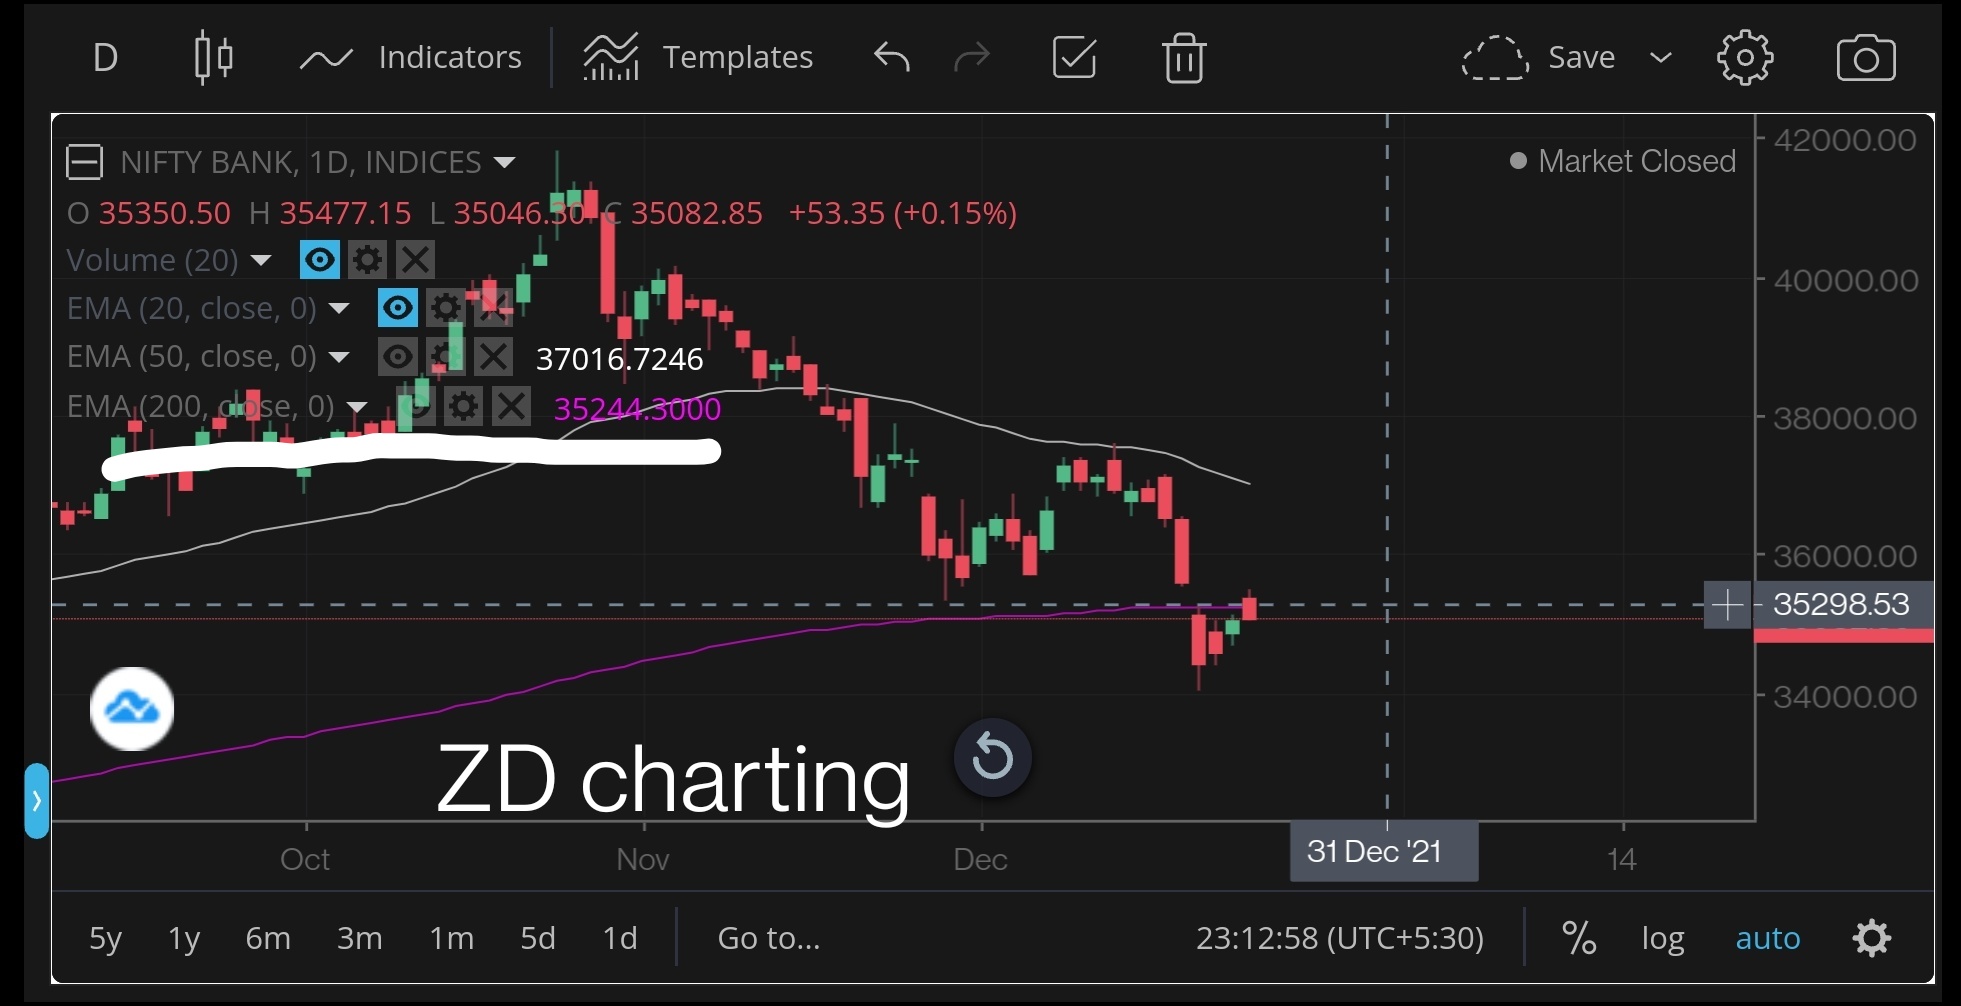
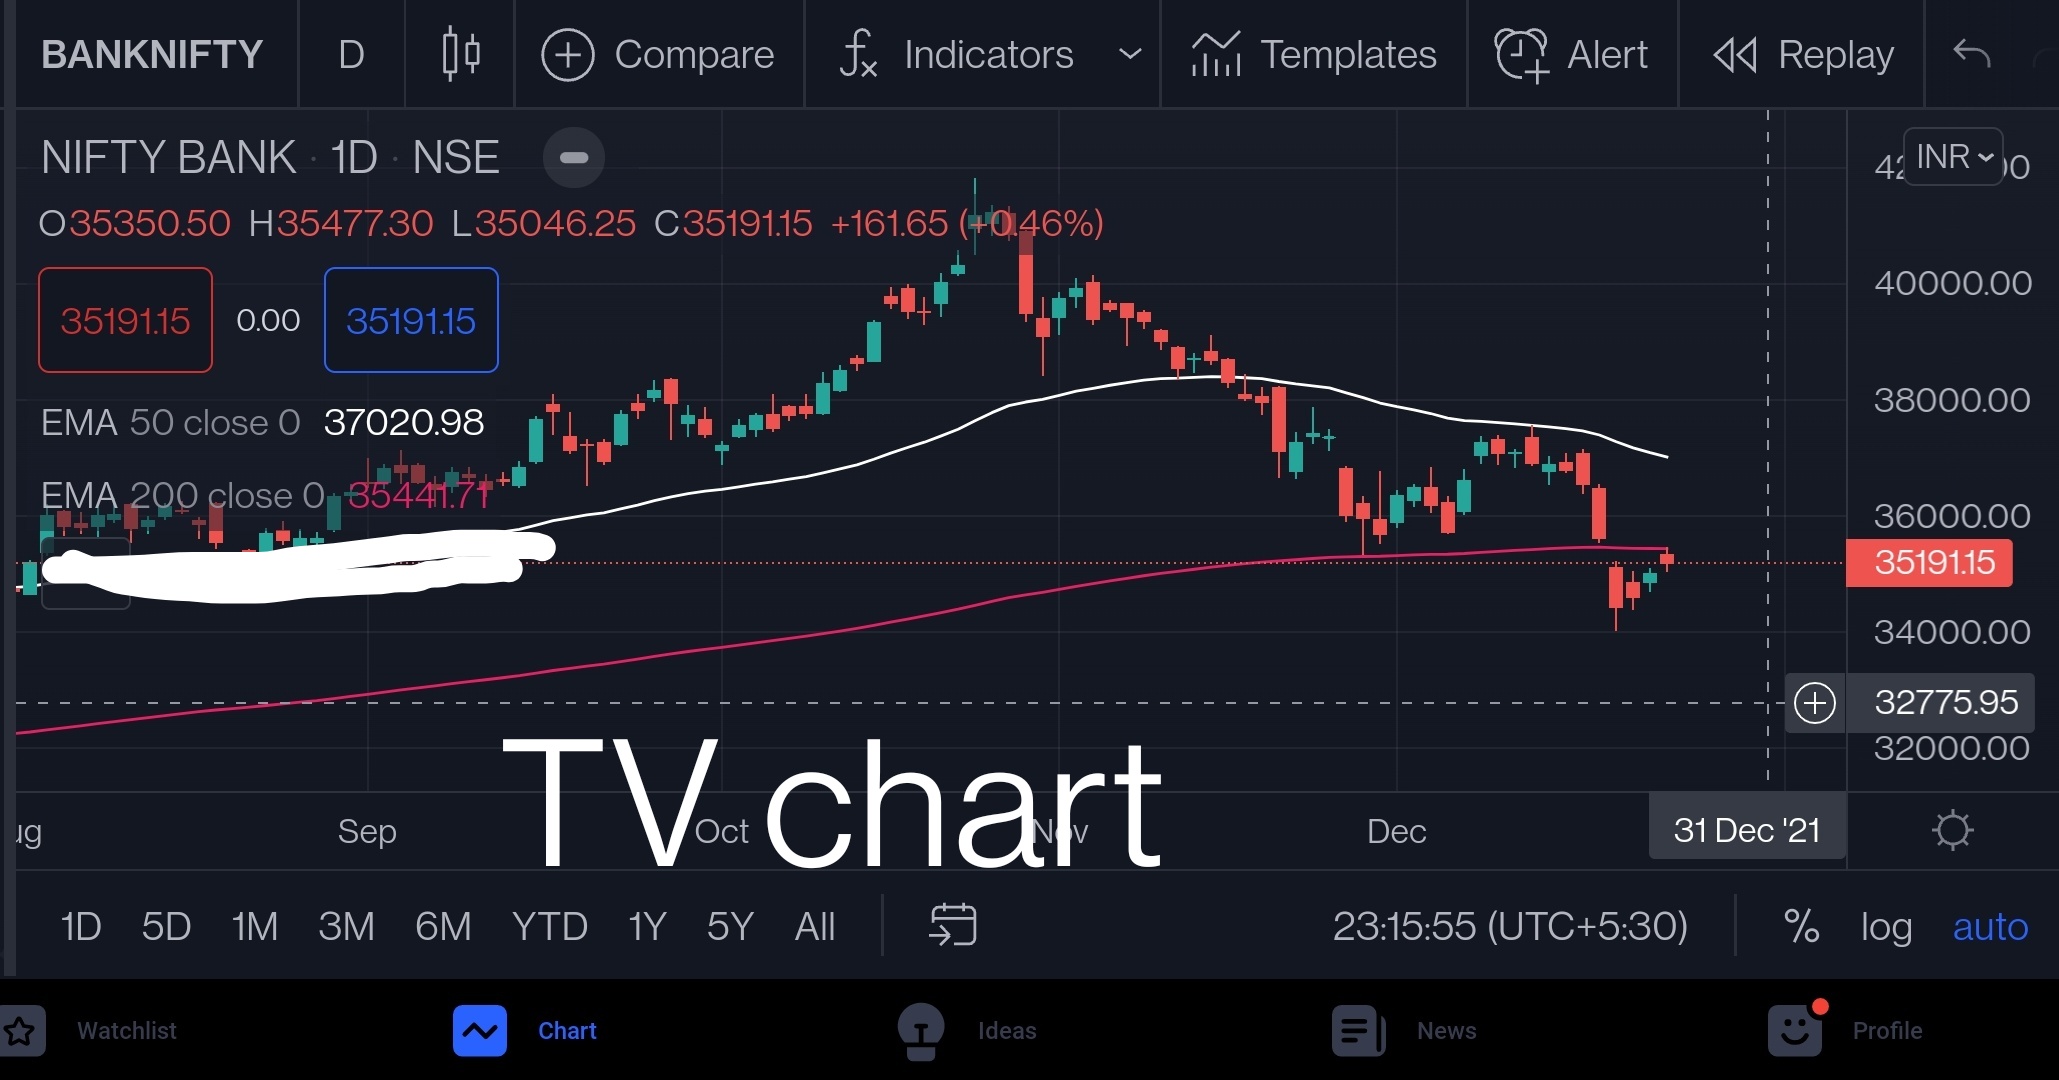
I have observed this since(actually before) Bank Nifty has broken the 200 EMA on daily time frame, that the charts on ZD have 200 EMA different from that on Trading View(TV)
Eg. Today TV had 200 EMA ~ 35441 whereas ZD had the same ~ 35244…snapshots attached.
I have seen such discrepancies more often in ZD, like the OHLC in figures is usually spot on, but the charts are usually with issues!
As per my knowledge, the indicator values calculated based on how many bars has been counted.
May be TV calculate more bars than zerodha, so it calculates the moving average with more candles.
BTW, for more comparison try on chartiq, icharts, & more charting web.
*this is my personal view, experts can tell the exact reason.
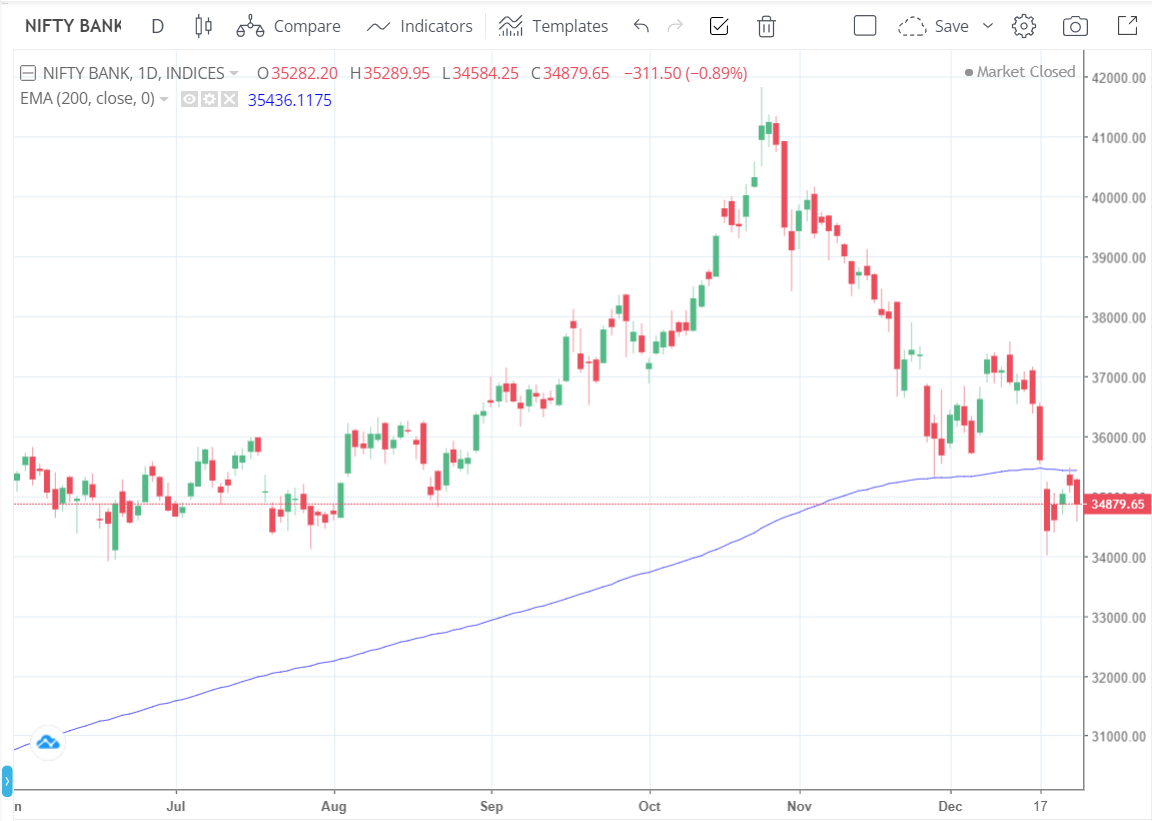
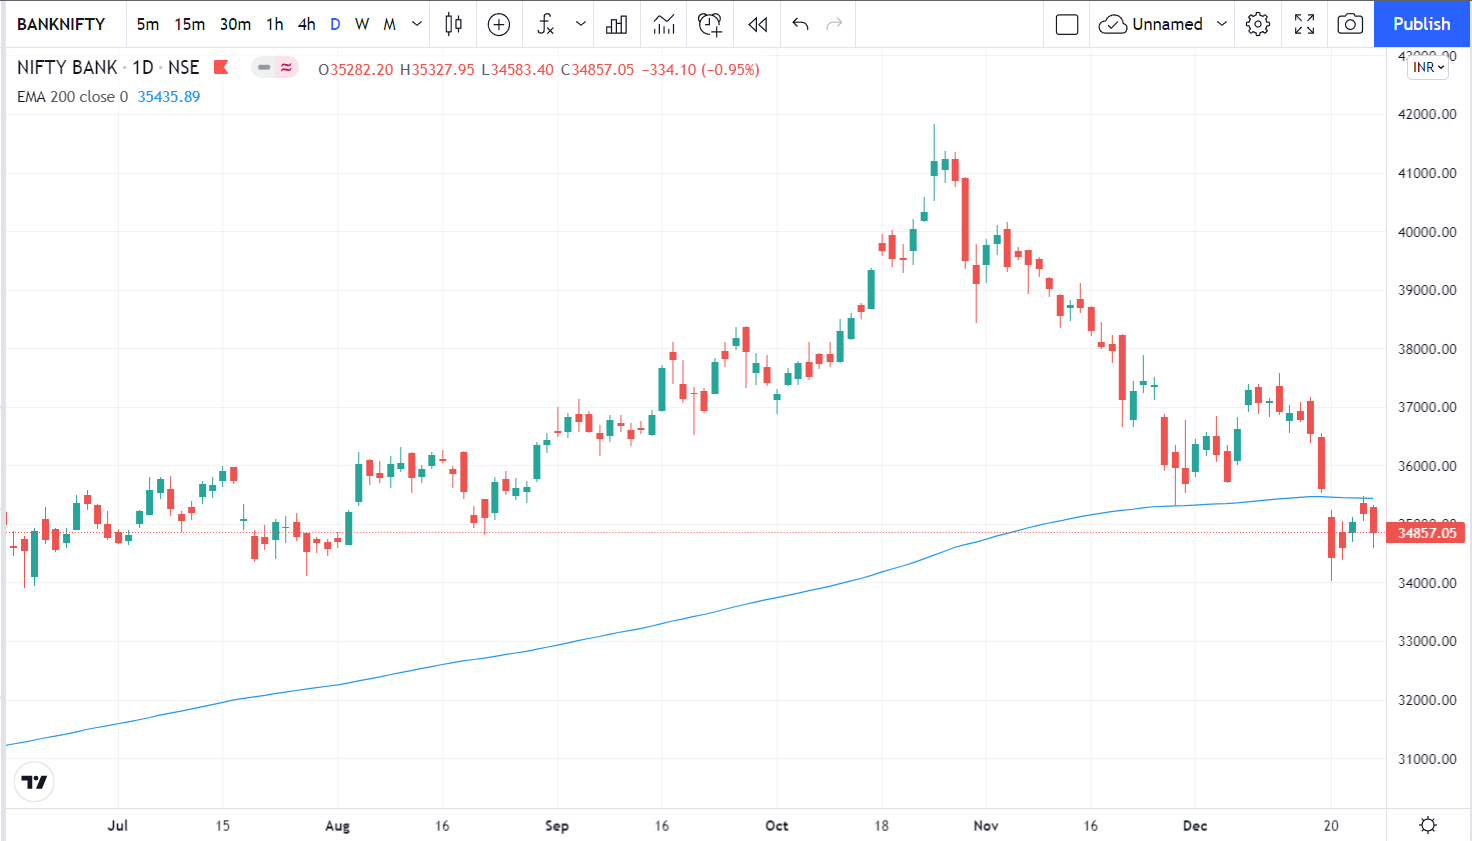
As @eaglem said, the indicator values are calculated based on the number of Candlesticks. In the above screenshots, the number of Candles loaded on TV Charts on Kite are less compared to the TV website. Hence the difference.
So once you apply the indicator or reload the charts, just zoom out once to load more Candles and zoom in again. Check the charts below for TV on Kite and on the TV website. Data for 200 EMA is similar.
Well typically charting platforms automatically take the number of bars required for calculation even if they are not visibly present on the chart. Users can zoom in and out and if indicator values change then there is a problem.
As a side note tv free users get around 5000 bars and paid users get around 10000 bars.