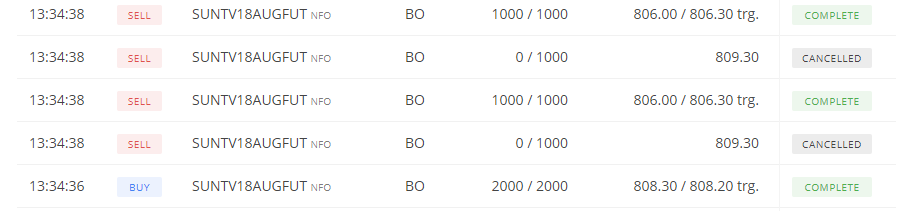
I traded SUNTV AUG FUT today(21 Aug 2018) with BO - SL order.
Trigger price was 808.2 and buy price was 808.3 with Target 1 and SL as 2 points.
The buy order got executed at 13:34:36 with the buy price 808.3 which was perfect. However, the position got squared off and the sell order was executed at the price 806 at 13:34:38 .
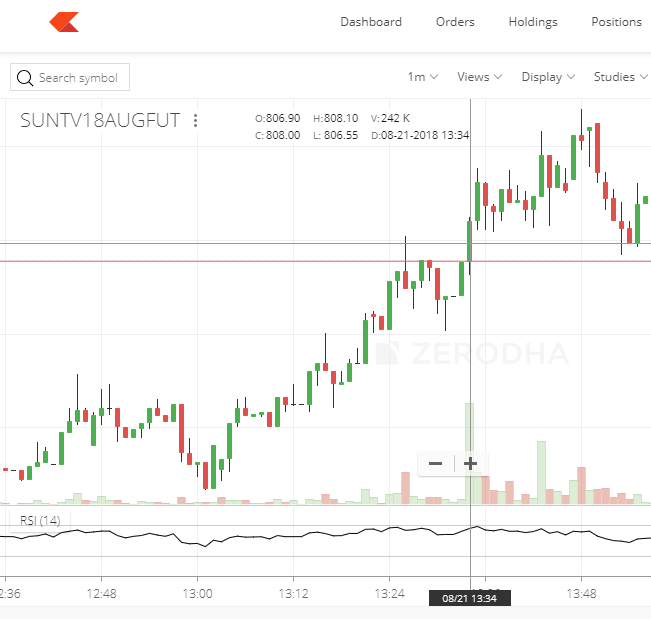
Point is SUNTV AUG FUT’s price never came down to 806 at all as per the chart and it only went up.
I feel trapped with Zerodha. Could someone from your team explain why this has happened?
There is nothing suspicious or fraud about this. On the other hand this is an utterly normal scenario and happens from time to time. As because the Chart cannot capture all the ticks or trades that takes place at a minute so it might not show up sometimes but we have all seen this happen so nothing fishy about it. There are literally thousands and thousands ( maybe even millions but you get the idea ) of trades/ticks generated by the exchanges in each unit of time, so its not possible for a Web browser based Trading platform to capture all of it as it will require substantial amount of CPU, memory and network bandwith to capture all of it.
If you still require second by second accurate ticks/trades then you have to find some other special platforms which are specifically designed to do so. And also you have to pay for the additional data feeds which are generally quite expensive.
There could be millions of transactions and I agree it’s technically or economically not feasible to show tick by tick prices.
However, I think if you/any other platform are displaying 1m charts, you should at least display open/close/high and low prices ACCURATELY. Otherwise, I think you should just remove 1m chart.
I might agree with this explanation from your answers about the possibilities and also could very well verify the transactions on the exchange.
However, I don’t see a reason why this shouldn’t look suspicious for a trader who actually goes through this.
Also, when you say this is one of the most asked questions, I think it makes sense to have a solution(At least get the O/C/H/L for the minute if not for the tick). Otherwise, you’ll receive more stupid questions like this one by me for sure.
Like I have mentioned in the previous answer, no trading platform chart can capture all trades that happen on the exchange. The only way this would be possible would be if exchange streamed OHLC for every minute instead of giving us 1 second snapshot data. Even if someone were to consume tick by tick data on exchange colocation (not all exchanges have this) and make candles, it can’t be streamed from the colo. The best that can be done is at the end of the day, the candles can be replaced. This is how we do for the daily candles. we replace it with what exchange gives us as OHLC for the day at close of day.
Intra day futures charts in Kite are not at reliable. You should use Trade tiger or Interactive Brokers if at you want to refer to intraday charts in live environment, their charts simulate data feed more closely.
If you are studying after market hours, Trend 7 is best. I hope someday @nithin will realise the difference in the quality of the intraday charts at Kite.
There is no fraud here my dear…but Kite 1 min charts do have issues which are not getting rectified. The discrepancies are always there on charts sometimes you can attribute to the duration as we cannot see tick charts else the charting tool bug in kite…