Hi Friends,
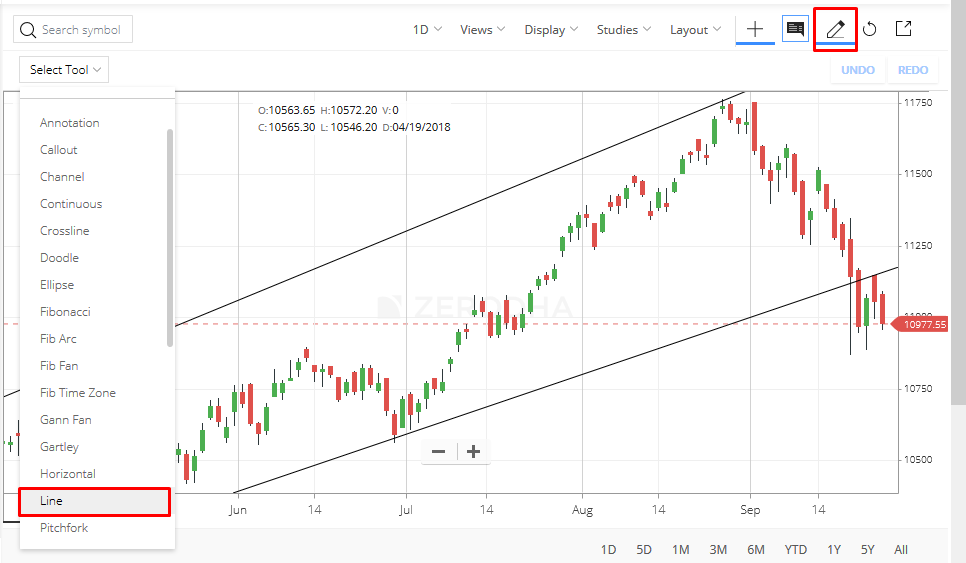
I am not able to find the tool the trend lines in kite. Please help me how to draw trend line
and what are the parameters to keep in mind while drawing them.
Hi Friends,
I am not able to find the tool the trend lines in kite. Please help me how to draw trend line
and what are the parameters to keep in mind while drawing them.
Thanks bros. Is there any condition such as no of days or price difference between the points to be connected ?
You can also select Ray from that Select Tool Dropdown menu… A Ray performs better when drawing trendlines in my opinion…
Generally trendlines are used to gauge the current trend in place so you need to spot the latest 2 swing high or low and draw the trendline… For confirmation of the trendline price needs to touch the trendline and react for the 3rd time… Once it did the 3rd touch the trendline is confirmed and signifies strong trend in place…
@ManishAstral : Bro, can you please let me know :
Essentially both are lines so they will look the same… But the way they are drawn is a bit different like i explained above…
But if price closes below the lower trend line and then it tried but couldn’t close above the trend line then this Trendline will reverse its role and act as a resistance…
Again to use this with confidence in realtime trading you need to actually spot such occurrences in a chart and see for yourself how the price action behaves around the trendline esp after it breaks or fails to break… Backtest the setups for atleast a few years to be fully confidence in how and why it works…