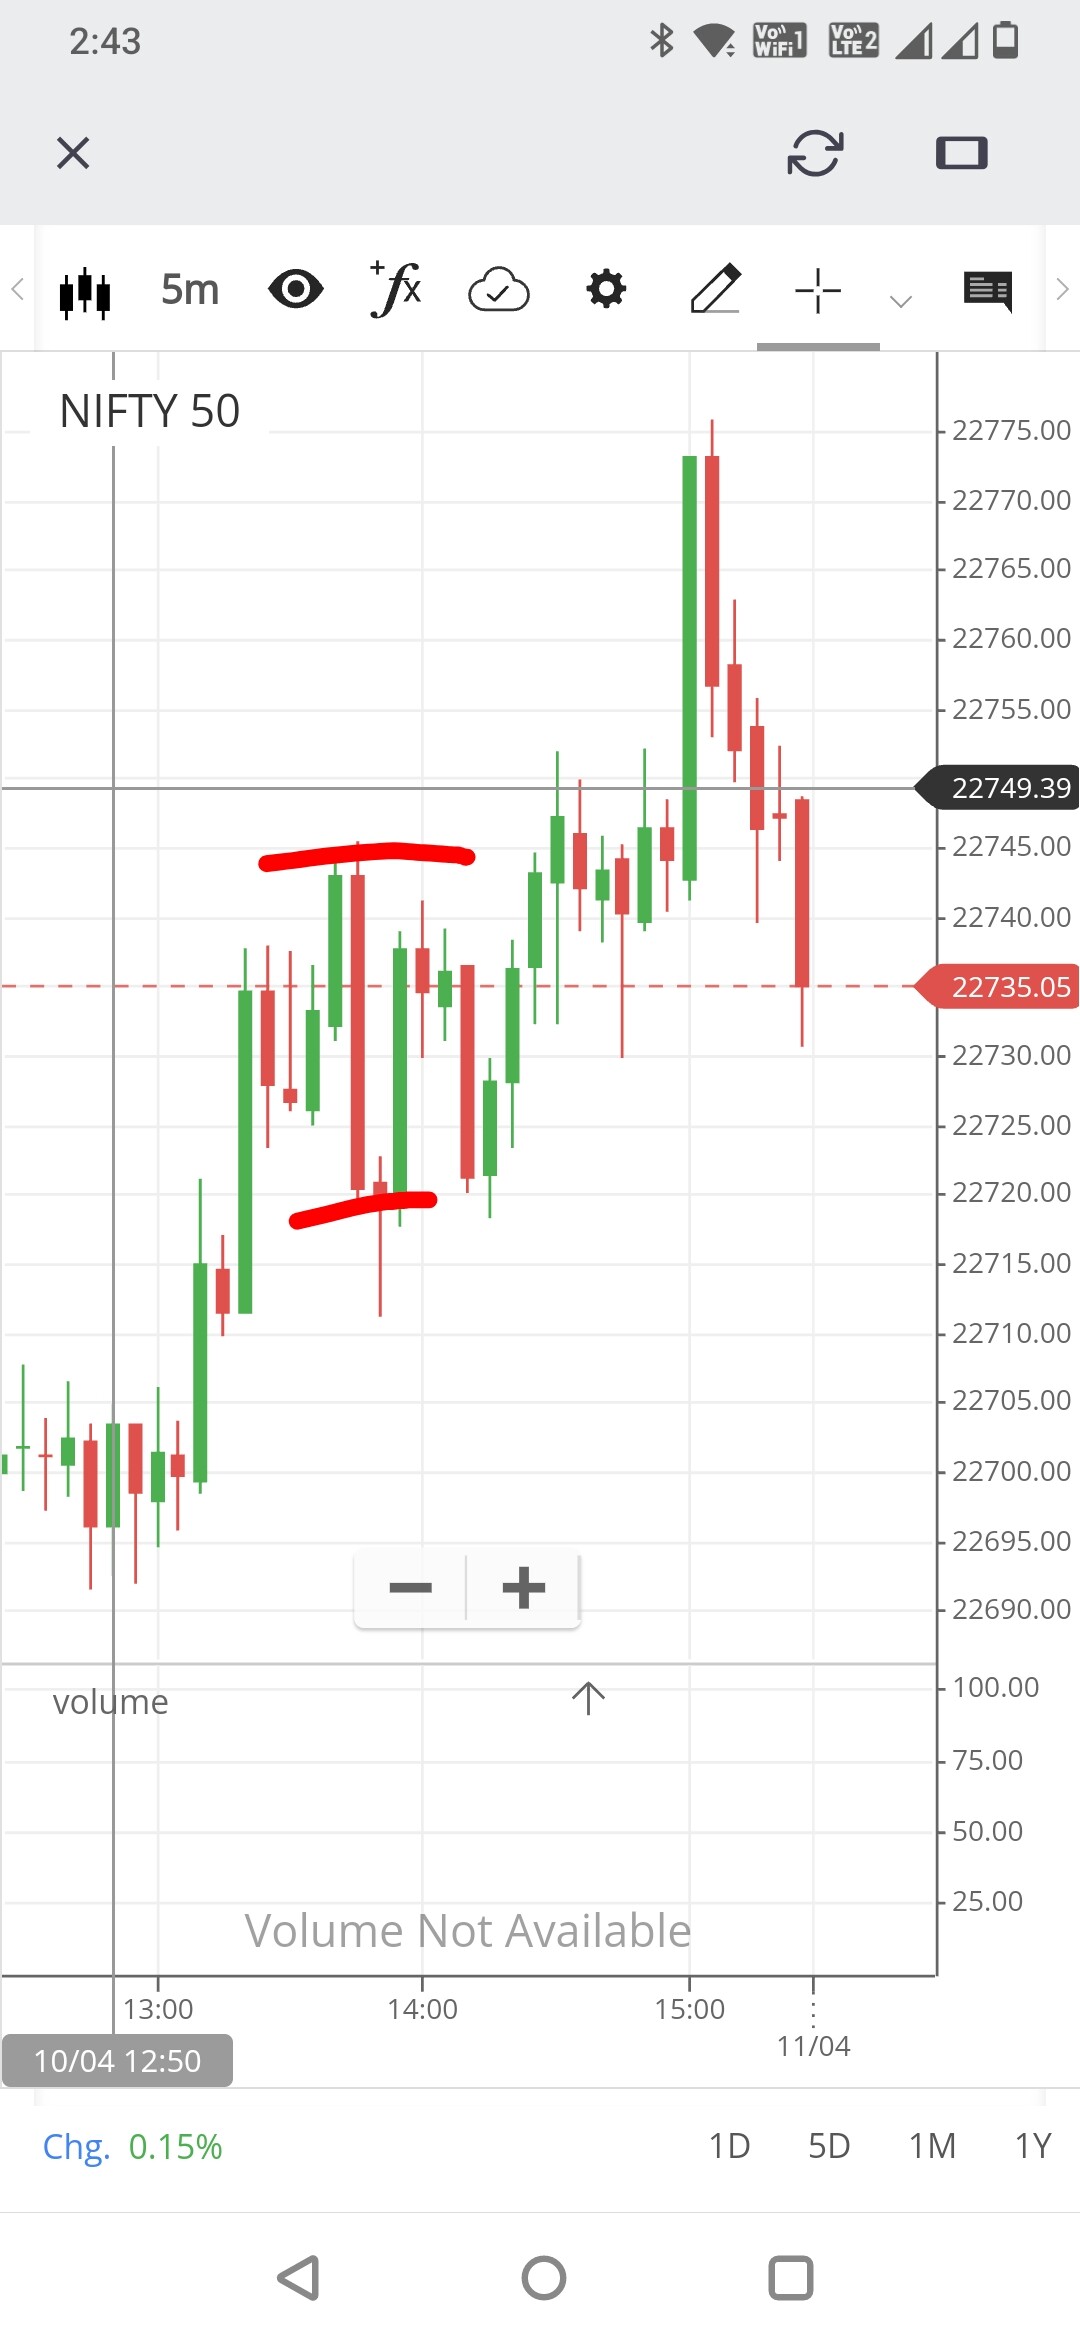
Hello everyone, on 10th of April I was analysing nifty chart and came across the bearish engulfing candle at 2:45 pm (5 mins chart), however market instead of going down it went up, I am unable to find the reason for same, can anyone help.me.with their guidance, any help from the community will be appreciated…
was weekly expiry of Nifty & Bank Nifty FNO Contracts , due to high volatility , most of the time during expiry day , near day closing TA will not work , Only the Trade Management works
That’s the whole point of trading, if it is so easy then why do many will loose money? First and most important lesson to learn is there is no guarantee of anything in markets, also one should never question the market ,just try to follow and update themselves, this comes with experience.
TA is just a tool which helps or guides us to be in a better position to take a trade but it may not work many times, it is a mix of science and art. So,one should learn what should we do when we are wrong, there comes risk management. Looks like you are new to trading, maybe you should go through risk management concepts also from varsity here.
Thank @TIMEFRAME for your valuable time and inputs, as you said at the end of the TA doesn’t work does this apply in the morning as well…
Hello @siva8 thanks you for your valuable inputs and advice and many thanks for the risk mangement link, I will go through this and try to implement as well…
Everyone will see the bearish candle and contrarians will buy on that to trap the sellers.
and as a result they will panic and close out their position resulting in a big bullish candle that follows. You can see the same thing happen again with buyers at the high of the day.
This happens all day everyday. The patterns don’t mean anything. price and perceptions changes every second.
Why do you assume that just because there is a bearish candle , prices should go down.
There are many participants who look markets from different angles and trade different strategies.
Hello @trader_dude thank you for sharing this perspective and I agree with you that everyone has different perspectives and this can lead to situation opposite to our planning…
HI,
Your first step should be to analyse higher time frames like weekly and daily. When you get confidence in a higher time frame, move to a lower one.
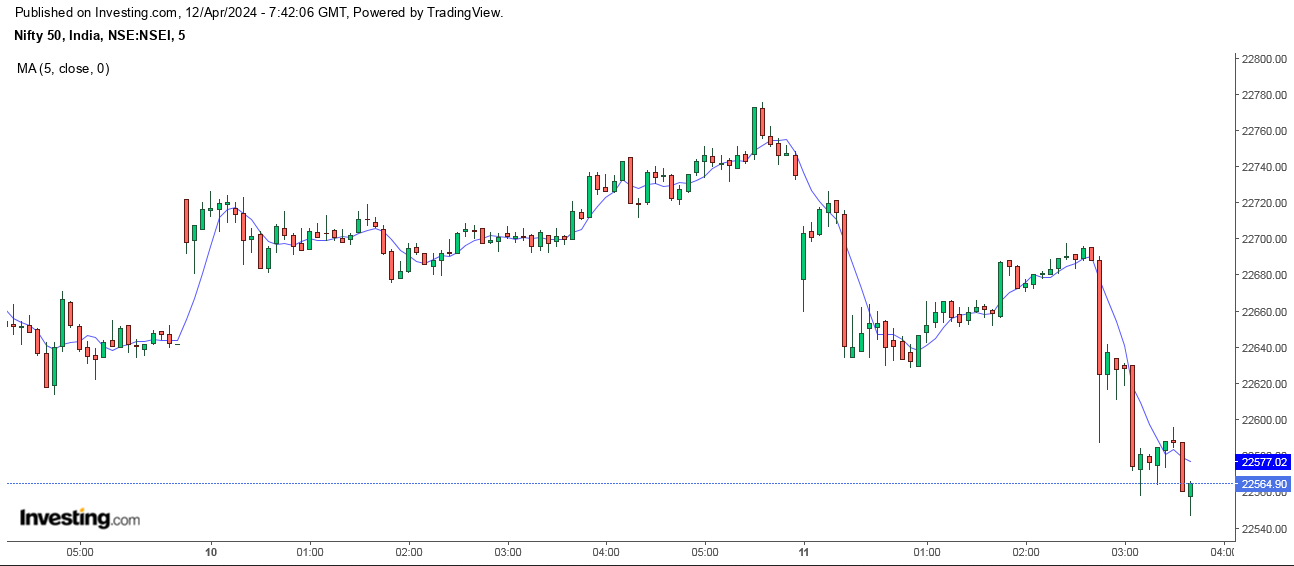
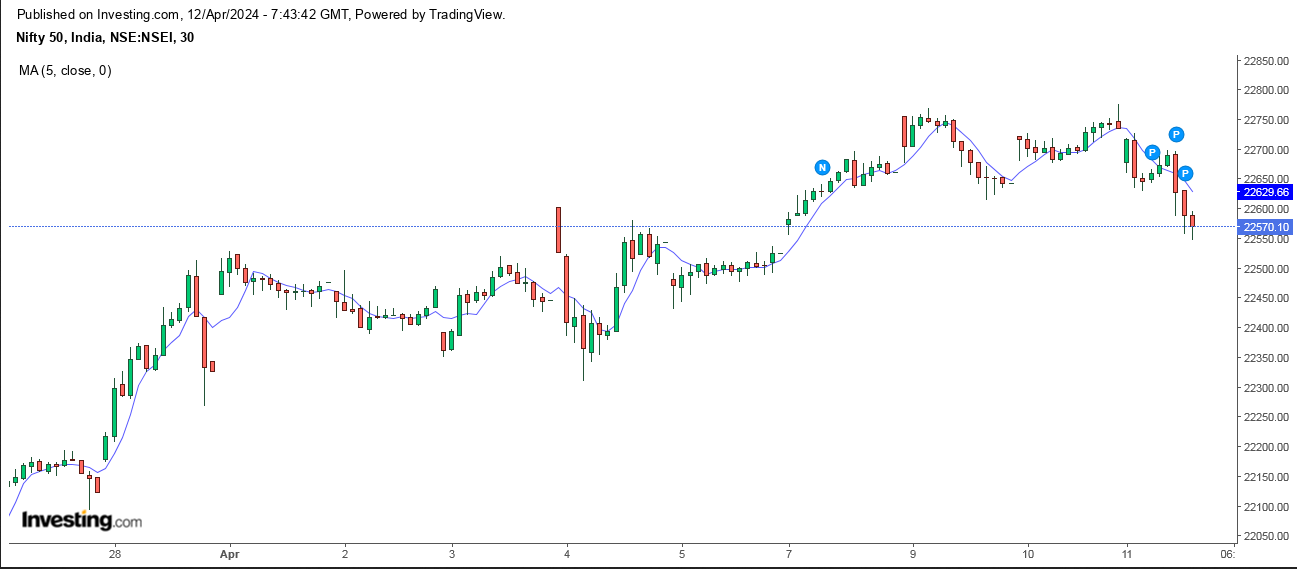
Hi Normally TA works on larger time-frame , due to high volatility , its very difficult to apply TA on shorter time frame , if you can observe the indices during weekly FNO expiry very high volatility will be there , especially during last trading hours . i do follow TA , but its a science & an Art like other members said, One need to learn the art of applying the TA , in simple words TA works 40 % out of say 100 , rest is Trade & Money Management and Probability of Market direction .
Just to illustrate , i have posted here 2 charts one is 5min & 30 min , if you compare both , its bit easy to trade based on 30 min chart time frame then 5min chart
2 Likes