How to set chart showing 2 line one of 20 EMA and another of 50 EMA.
I want to set chart showing in website
Icharts.in/chart.html
Open the chart and click on Studies and scroll down and select Moving Average 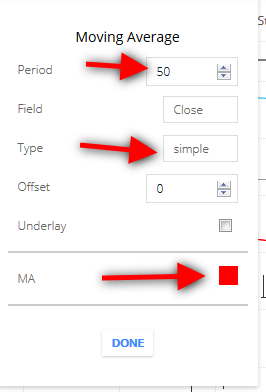
set the period to 50 or 20 click on the simple and choose Exponential
and choose your preferred color.
1 Like