Many new traders/investors wonder if its really possible to make money following simple rules. In fact, most of the trading educators/ trading gurus has made it look like making money in stock market is more complex.
No, its not.

Keeping it simple, always works. It is not the trading rules that makes money, it is all about the trader who follows the rules that matters. And remember when someone says, just follow these simple rules to make money, it doesn’t mean its so easy to follow that.

Let me tell you a simple trading rule.
Buy when the stock closes above 10 Month moving average and Exit the stock if it closes below 10 Month moving average.
That’s all, nothing complex.
Here’s the example of DHFL stock.
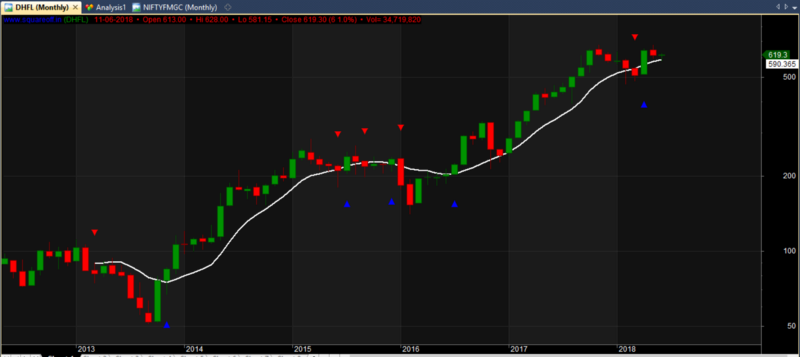
Those blue arrows denotes entry and red arrow denotes exit. As you can see, when large trend emerges, this simple rules makes very high returns.
Investment of 1 lakh has grown to 4 lakhs.
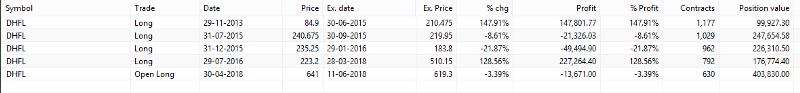
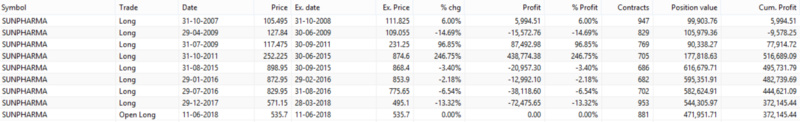
Even if this rule is followed with stocks like SunPharma, you still would have ended up in profits.
If the system is so simple, why people aren’t following it? Its because of winning % and drawdowns.
These kind of trend following systems will have accuracy of just 30 to 35% only. It means, you end up losing 70% of the time. For many traders/investors, it is very difficult to follow the trading rules when they face continues losing streaks. But professional traders know that winning % in a trading system is not important at all.

And then drawdowns, you cannot make money without withstanding the drawdown periods. It is inevitable. When there is no trend, or if the stock is stuck in sideways phase, we end up losing marginal amount. However, when a trend is established, this trading rule will keep you in the trend until it is over, thus resulting in large gains.
I have included the amibroker afl code here, try back testing it with historical data to find the robustness of the system.
_SECTION_BEGIN( "Price" );
SetChartOptions( 0, chartShowDates | chartShowArrows | chartLogarithmic | chartWrapTitle );
_N(Title = StrFormat("{{NAME}} - {{INTERVAL}} {{DATE}} Open %g, Hi %g, Lo %g, Close %g (%.1f%%) {{VALUES}}", O, H, L, C, SelectedValue( ROC( C, 1 ) ) ));
if( Status("action") == actionIndicator )
(
Title = EncodeColor(colorBlue)+ "www.squareoff.in" + EncodeColor(colorGreen)+" (" +  Name() + ") " + EncodeColor(colorRed)+
"  " + Date() +" " +" •  Open "+WriteVal(O,1.2)+"  •  "+"Hi "+WriteVal(H,1.2)+"  •  "+"Lo "+WriteVal(L,1.2)+"  •  "+
"Close "+WriteVal(C,1.2)+" ("+WriteVal(C-Ref(C,-1),1,0)+" "+WriteVal((C-Ref(C,-1))*100/Ref(C,-1),1.1)+ "%)  •  Vol= "+ WriteVal(V,1.0)
);
SetBarsRequired(100000,0);
GraphXSpace = 15;
SetChartOptions(0,chartShowArrows|chartShowDates);
//SetChartBkColor(ParamColor("bkcolor",ColorRGB( 150,50,150)));
GfxSetBkMode(0);
GfxSetOverlayMode(1);
SetBarFillColor(IIf(C>O,ParamColor("Candle UP Color", colorGreen),IIf(C<=O,ParamColor("Candle Down Color", colorRed),colorLightGrey)));
Plot(C,"\nPrice",IIf(C>O,ParamColor("Wick UP Color", colorDarkGreen),IIf(C<=O,ParamColor("Wick Down Color", colorDarkRed),colorLightGrey)),64,0,0,0,0);
_SECTION_END();
SetPositionSize(1,spsShares);
SetTradeDelays(0,0,0,0);
//SetTradeDelays(1,1,1,1);
RoundLotSize = 1; // Define Round Lot Size of the Trading Instrument
SetPositionSize ( 100,spsPercentOfEquity ); // Define Fixed Trading Size
SetOption( "InitialEquity", 100000 );
SetOption( "MinShares", 1 );
SetOption( "MinPosValue", 1 ); // Enable Futures Mode
SetOption( "FuturesMode", False );
SetOption( "AllowPositionShrinking", True );
SetOption( "ActivateStopsImmediately", False );
SetOption( "ReverseSignalForcesExit", False );
SetOption( "AllowSameBarExit", False );
SetOption( "CommissionMode", 2 ); // Fixed Brokerage Commissions (Per Trade)
SetOption( "CommissionAmount", 0 ); // Rs 100/Leg Commisions
SetOption( "InterestRate", 0 );
SetOption( "MarginRequirement", 100 ); //Define Margin Requirement
SetOption("AccountMargin", 100 ); //Define Account Margin
Buy=C>MA(C,10);
Short=C<MA(C,10);
Buy=ExRem(Buy,Short);
Short=ExRem(Short,Buy);
Sell=Short;
Cover=Buy;
BuyPrice=ValueWhen(Buy,C);
SellPrice=ValueWhen(Sell,C);
ShortPrice=ValueWhen(Short,C);
CoverPrice=ValueWhen(Cover,C);
PlotShapes(Buy*shapeSmallUpTriangle,colorBlue ,0,L,-51);
PlotShapes(Sell*shapeSmallDownTriangle,colorRed,0, H,-51);
_SECTION_END();
_SECTION_BEGIN("MA2");
P = ParamField("Price field",-1);
Periods = Param("Periods", 15, 2, 300, 1, 10 );
Plot( MA( P, Periods ), _DEFAULT_NAME(), ParamColor( "Color", colorCycle ), ParamStyle("Style") );
_SECTION_END();
Definitely, it is possible to make money in stock market with simple rules.
Source: https://medium.com/squareoff-in/a-simple-stock-trading-system-that-works-8b37f4f1349a