Hello Sir,
Kindly help me to modify existing AFL script which have syntax errors. Add below conditions.
ADD Below indicaters
12 EMA
ATR trailing STOPS 7,3
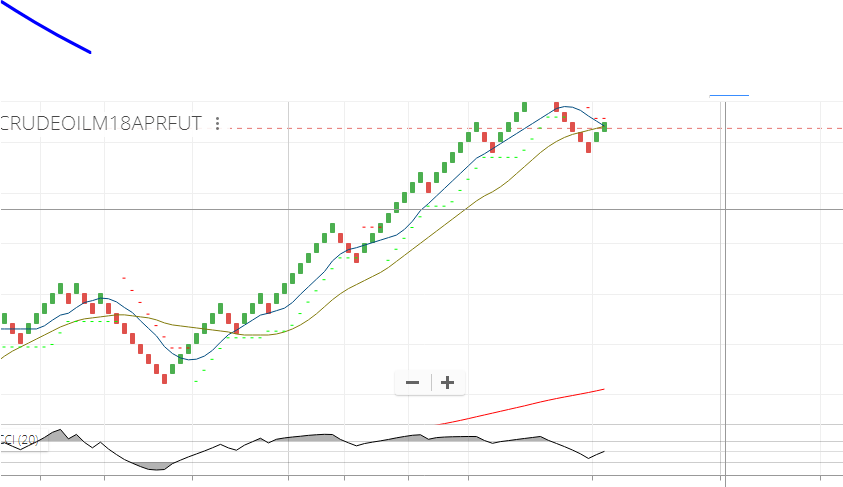
RENKO chart
CCI indicator
BUY-- Cross over CCI (20) 100 and moved above 12 EMA. or Create Green BRICK.
Sell – CCI move below -100 and Crossover 12 EMA or create RED Brick
This statagy will help for lot of peoples small traders to earn profits. if anyone have good AFL knoledge kindly help me and as well as the peoples who are searching for good stratagies.
// Modified Renko Chart with custom date axis
// and high/low winks
// Loosely based on Renko chart formula by G. Kavanagh
// from AmBroker on-line formula library (id=521)
// Modifications & fixes TJ 2014
function FillRun( dir, num, changedir )
{
global i, j, modified, dt, RKC, RKO, RKD, RKH, RKL;
for( x = 1; x <= num AND j < BarCount - 1; x++ )
{
    j++;
    extra = ( changedir AND x == 1 ) * dir;
    RKC[ j ] = RKC[ j - 1 ] + dir + extra;
    RKO[ j ] = RKC[ j - 1 ] + IIf( modified, 0, extra );
    RKD[ j ] = dt[ i ];
    RKH[ j ] = High[ i - 1 ];
    RKL[ j ] = Low[ i - 1 ];
}
}
SetBarsRequired( sbrAll, sbrAll );
Brick = Param( “Brick Size”, 0.001, 0.0001, 1.00, 0.001 );
reverse = 2;
intra = ParamToggle( “Intraday”, “No|Yes”, 0 );
modified = ParamToggle( “Modified”, “No|Yes”, 0 );
// Convert the closing price to rising and falling rounded bricks
CF = ceil( C / Brick );
CR = floor( C / Brick );
// initialize first element
j = 0;
RKC[j] = CF[0];
RKO[j] = CF[0] + 1;
RKD = 0;
RKH = 0;
RKL = 0;
dt = IIf( intra, floor( TimeNum() / 100 ), DateNum() );
dir = -1; // 1 is up, -1 is down
// Loop to produce the Renko values in number of bricks
for( i = 1; i < BarCount - 1; i++ )
{
if( j >= BarCount )
break; // no more room → finish
if( CF[i] <= RKC[j] - 1 AND dir < 0 )  // Continue down
{
    num = RKC[j] - CF[i];
    FillRun( dir, num, False );
}
else
    if( CR[i] >= RKC[j] + Reverse AND dir < 0 )  // Change down to up
    {
        num = CR[i] - RKC[j];
        dir = 1;
        FillRun( dir, num, True );
    }
    else
        if( CR[i] >= RKC[j] + 1 AND dir > 0 )  // Continue Up
        {
            num = CR[i] - RKC[j];
            FillRun( dir, num, False );
        }
        else
            if( CF[i] <= RKC[j] - Reverse AND dir > 0 )  // Change up to down
            {
                num = RKC[j] - CF[i];
                dir = -1;
                FillRun( dir, num, True );
            }
}
// move the chart to right end of chart space, ie last brick on last bar position
delta = BarCount - 1 - j;
RKC = Ref( RKC, -delta );
RKO = Ref( RKO, -delta );
RKD = Ref( RKD, -delta );
RKH = Ref( RKH, -delta );
RKL = Ref( RKL, -delta );
C = RKC * Brick;
O = RKO * Brick;
H = IIf( modified, RKH, Max( C, O ) );
L = IIf( modified, RKL, Min( C, O ) );
Plot( C, “”, IIf( C > O, colorGreen, colorRed ), styleCandle );
m1 = MA( ( C + H + L ) / 3, 8 );
m2 = MA( C, 8 );
Plot( m1, “SMA Typ”, colorBlue );
Plot( m2, “SMA Renko”, colorOrange );
Cover = Cross( m2, m1 );
Sell = Cross( m1, m2 );
Short = Sell AND C < O;
Buy = Cover AND C > O;
PlotShapes( shapeUpArrow * Buy, colorGreen, 0, m1 );
PlotShapes( shapeDownArrow * Sell, colorRed, 0, m1 );
PlotShapes( shapeHollowUpArrow * Cover, colorGreen, 0, m1, -25 );
PlotShapes( shapeHollowDownArrow * Short, colorRed, 0, m1, -25 );
color = IIf( Flip( Buy, Sell ), ColorRGB( 220, 255, 220 ),IIf( Flip( Short, Cover ), ColorRGB( 255, 220, 220 ), colorWhite ) );
Plot( 1, “”, color, styleArea | styleOwnScale, 0, 1, 0, -1 );
xnum = floor( RKD / 1000 );
XChange = IIf( xnum != Ref( xnum, -1 ), 1, Null );
Plot( XChange, “”, colorGrey50, styleHistogram | styleOwnScale, 0, 1 );
// Draw renko-date axis
MonthNames = “Jan,Feb,Mar,Apr,May,Jun,Jul,Aug,Sep,Oct,Nov,Dec”;
fvb = FirstVisibleValue( BarIndex() );
lvb = LastVisibleValue( BarIndex() );
for( i = fvb; i < lvb; i++ )
{
if( XChange[ i ] )
{
if( intra )
datetext = StrFormat( “%02gh”, floor( RKD[ i ] / 100 ) );
else
if( ( xnum[ i ] % 100 ) == 1 )
datetext = StrFormat( “%04.0f”, 1900 + ( xnum[ i ] / 100 ) );
else
datetext = StrExtract( MonthNames, ( xnum[ i ] % 100 ) - 1 );
    PlotText( datetext  , i, LowestVisibleValue( Low ), colorGrey50, colorWhite, -20 );
}
}
Title = Name() + StrFormat( " - 20%06.0f", RKD % 1000000 ) + " - Renko Chart : Last Value = " + RKC * Brick + " H: " + RKH + " L: " + RKL + ", Brick Size = " + Brick;
GraphXSpace = 5;