Hi Guys, I am new to trading and have been following varsity for some time now. My question is a basic question which is while we are on a daily price chart and when we are trying to understand the prior trend, how many candlesticks data do I need to analyse to understand whether it’s a downtrend or uptrend.
It’s not the quantity of the candlesticks , but the nearest lows and highs determine the trend. If previous pivot low is broken , then it’s downtrend and vice versa.
1 Like
Hi Varun, could you please explain me in a simpler way if possible.
Hard to explain.
Simply go to the nifty chart look at reversal points and try to analyse or get an idea about why it may have reversed.
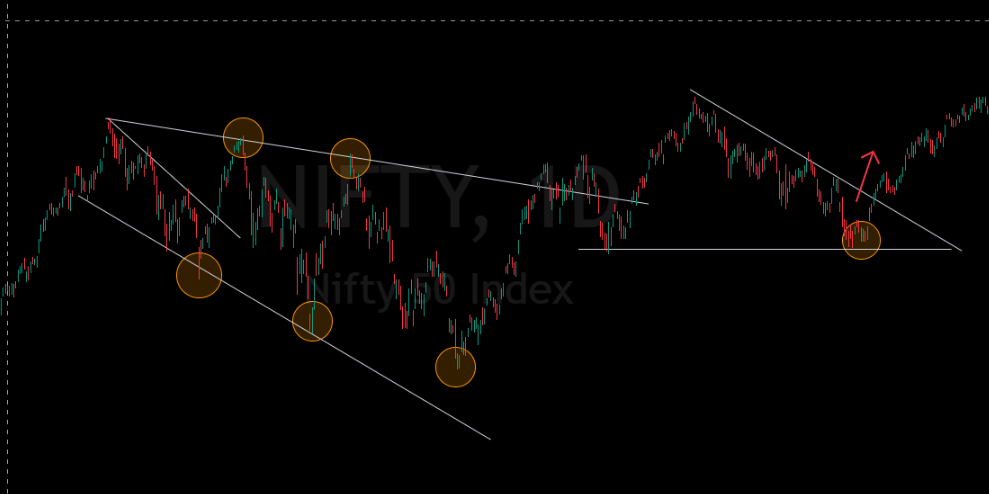
Analyze all the highlighted points/areas. (You will figure something out, if not anything)
1 Like
Mostly i think just break of the higher lows in uptrend and lower highs in downtrend, you know how trend works!
When trend is in continuation, it forms higher highs in up while lower lows in downtrend. Sometimes, price bounce back from the last higher low in case of uptrend and lower high in case of downtrend.
What will gonna happen is just determined by this, a kind of opinion, but you should always follow the price (be flexible), and trade as per that (destination maybe same but mostly price have its own plans as what path it will choose from one to another destination). I think other community members can shed some more light on this!