Would it be efficient to analyze the 4-hour charts in Indian equity segment for trading signals?
Since the trading hours in NSE equity are from 9:15 am to 3:30 pm, the candlesticks alternate between 4-hour (9:15 am to 1:15 pm) to an approx 2-hour (1:15 pm to 3:30 pm) timeframe. It isn’t a continuous series of activity snapshots every four hours. So, does use of 4-hour charts be of good use in equity segment for positional/swing trades?
Even with 1-hour charts, every 7th candlestick would only be a 15-minute activity snapshot (3:15 pm to 3:30 pm), how should one account for this in technical analysis?
Thanks. I currently use the End of the day charts for taking positions for a day or two. But, I wanted to know under what context would the the 4 hour charts serve the purpose? Any traders here who use it? It would be great to know the pros & cons of using it.
There are no such thing as a timeframe serving a purpose…
Traders choose different timeframe according to their trading style and strategy. Each timeframe is useful in that sense. So 4Hr might be useful for some trader looking for catching some good swings. But in general 4Hr doesn’t even have 2 full bars only one and a half or something bars so its better to use the daily instead.
I do use 4 hour charts , 4 hour chart is very useful , in case of both long/short trading. it helps to hold the positions for few trading sessions , it helps to avoid intra-day gyrations.
Well If you compare hourly chart and 4 hour chart , in hourly chart you can see more gyrations or whipsaws and makes us to exit or to enter prematurely , For example if you compare the INFY hourly chart & 4 hour chart from 7-1-2019 to 23-1-2019 ,( from level 670 to 763 ) hourly chart gave many sell signals/whipsaws ( Ex on 9th , 17th ) where as 4 hourly chart gave sell signal on 23-1, so if one used hourly chart , it made to take many trades , where as 4 hour chart allowed to ride the price moment from 670 to 763 in one single trade. In simple words 4 hour chart is helpful for positional trade .
For all segments.
It doesn’t, if line chart is considered , i don’t give much importance to the candle , i consider the closing price & its action near moving averages.
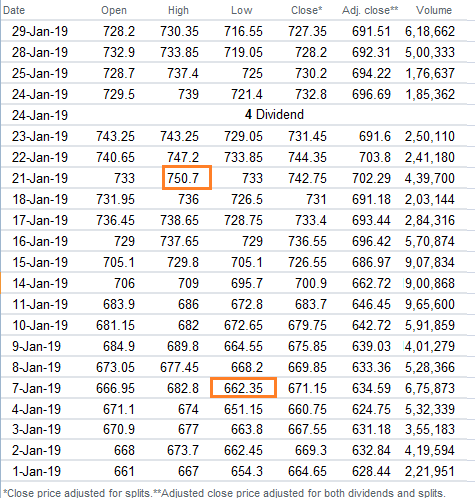
Sorry but i am not seeing any level of 763 between these period.I am seeing level of 751 for potential sell on 01/21 .Would be happy if i got my mistake corrected
Yes ,high level of INFY on 01/21/2019 was 750.7 , The error or explanation , may be due to the range chartically analysised or expected range , or it may the price taken by using the cursor , see the images , Yes it is too late to correct Thing is that , context was how useful 4hour chart , And sell level of both 751 & 763 was right hope next time you will correct me quickly if any
Thank you Actually I was looking article regarding use of 4Hrs Timeframe in trading and i got your post.Your post was useful for me so while I was looking chart as per your reply i got confused regarding price you have mentioned It is cleared now.Again thanks a lot.