One of the ideas we’ve been playing with was creating a weekly newsletter where we explore some of the most interesting charts about the financial markets and the economy. So, we figured, why not just start? This is the first edition! It’s still a bit rough, and we know it can be a lot better. So, please read it and let us know your feedback in the comments.
If you enjoy it, we’ll make this a regular thing—bringing you new charts every week to explain what’s happening in the markets and the economy. The goal is to keep it visual and easy to follow. This way, you’ll get a broader perspective than what we cover in shorter shows like The Daily Brief and The World, Simplified .
We’re still figuring out what to call this newsletter, and we’d love your suggestions. We also have rewards for the funniest suggestion and the one we ultimately choose. So, do share your ideas in the comments.
If you prefer to watch instead of read, you can watch video version of this edition here:
Current market sentiment
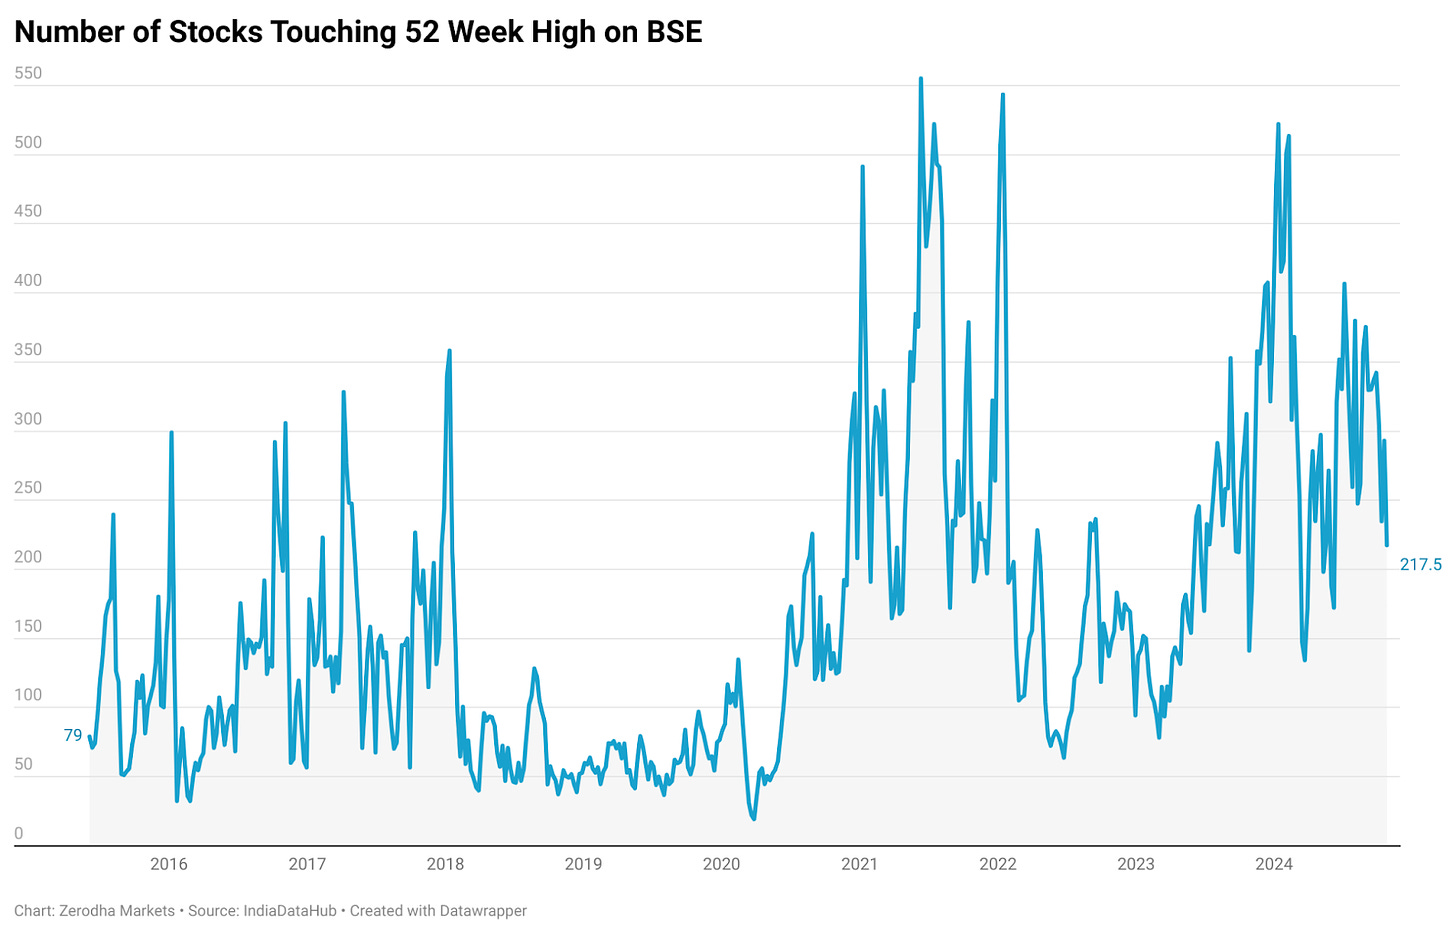
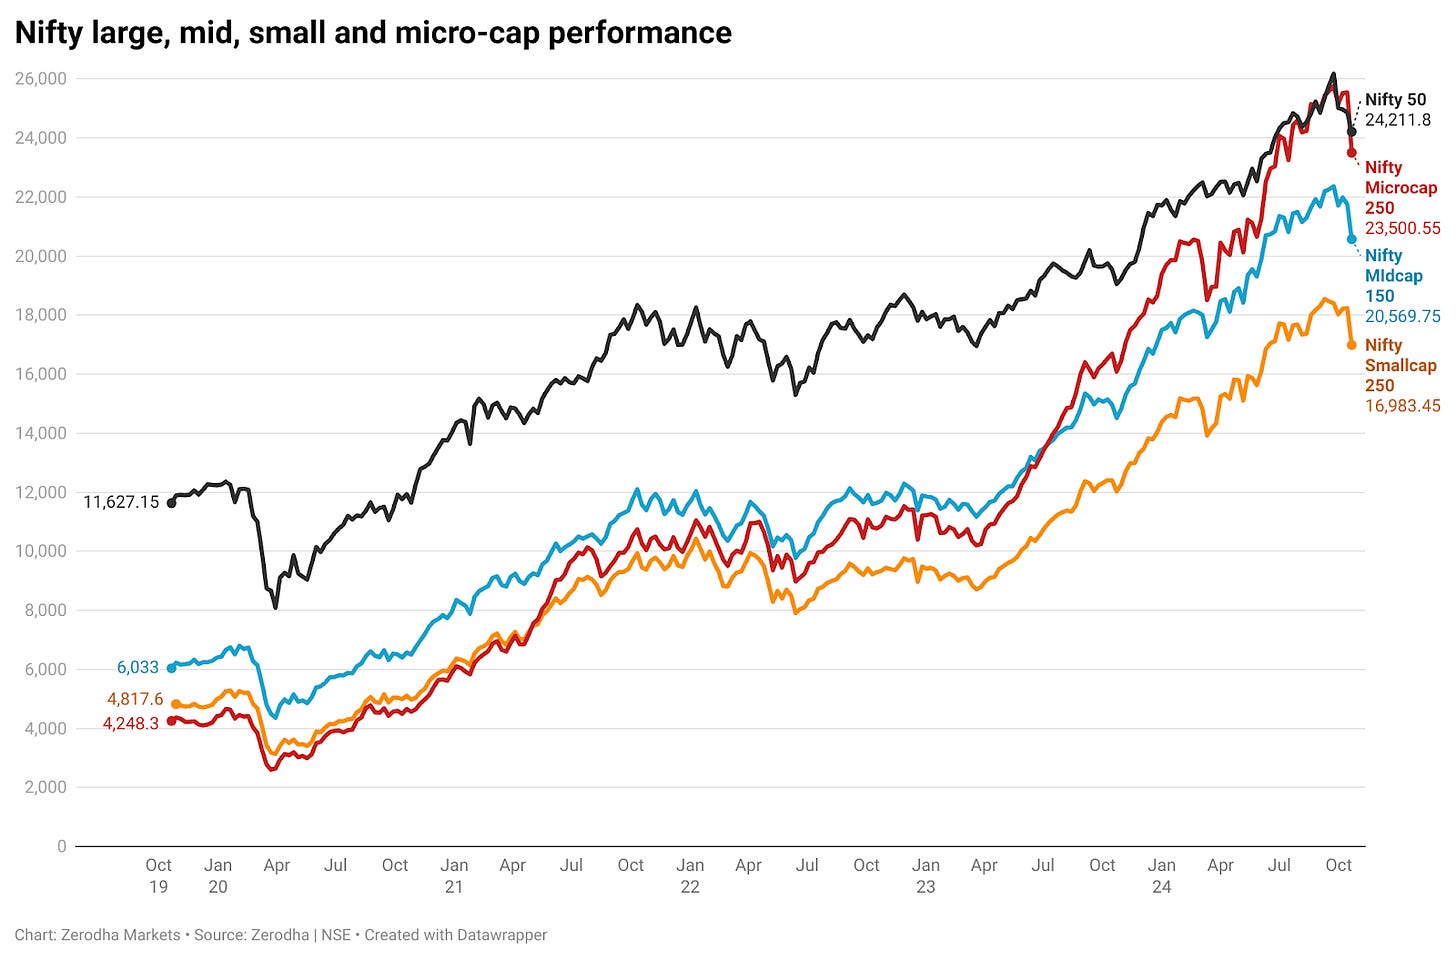
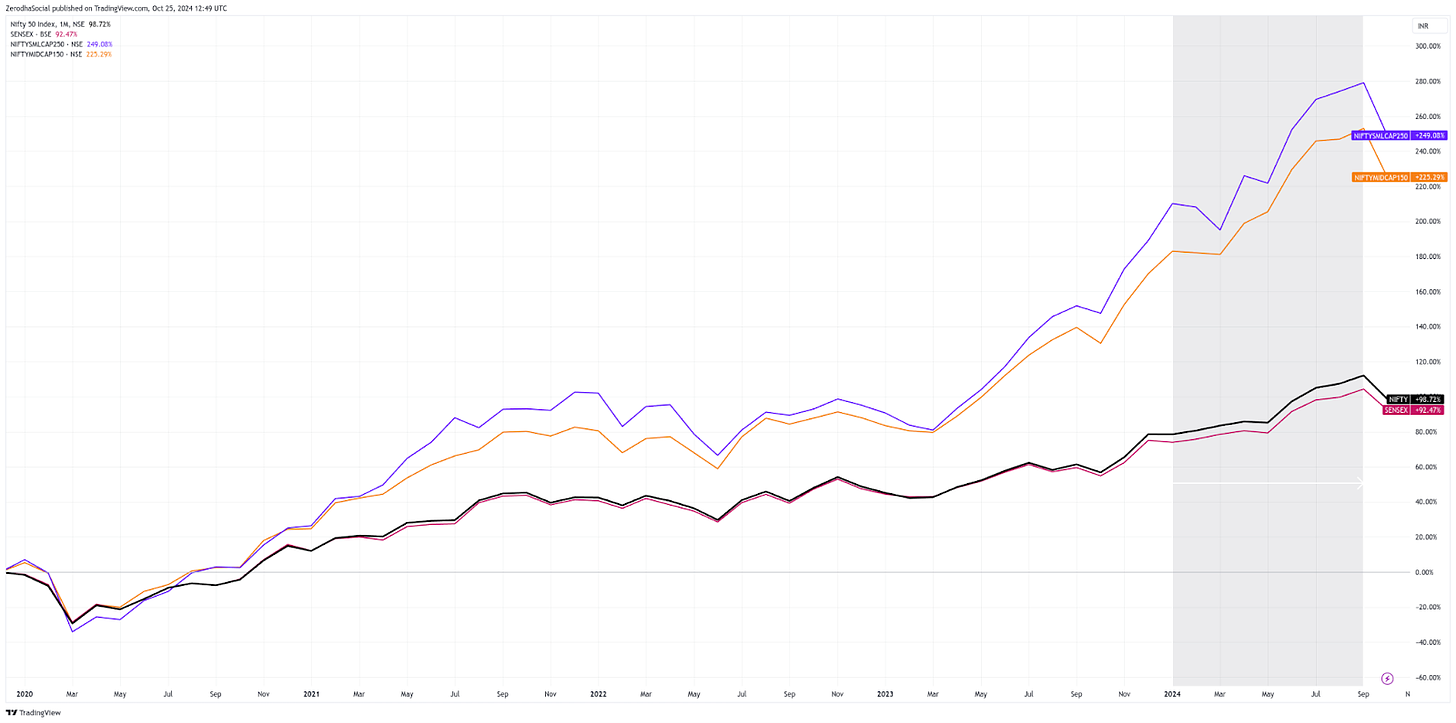
Nifty large, mid, and small-cap indices are down by about 7-8% from their peak. But beyond the indices, the market breadth has weakened. In simple terms, market breadth shows how the market is doing overall—are more stocks going up or down?
One way to check this is by looking at the number of stocks hitting 52-week highs. On average, around 330 stocks used to hit this mark, but now it’s down to 217. That tells us that under the surface, the market isn’t doing so well.
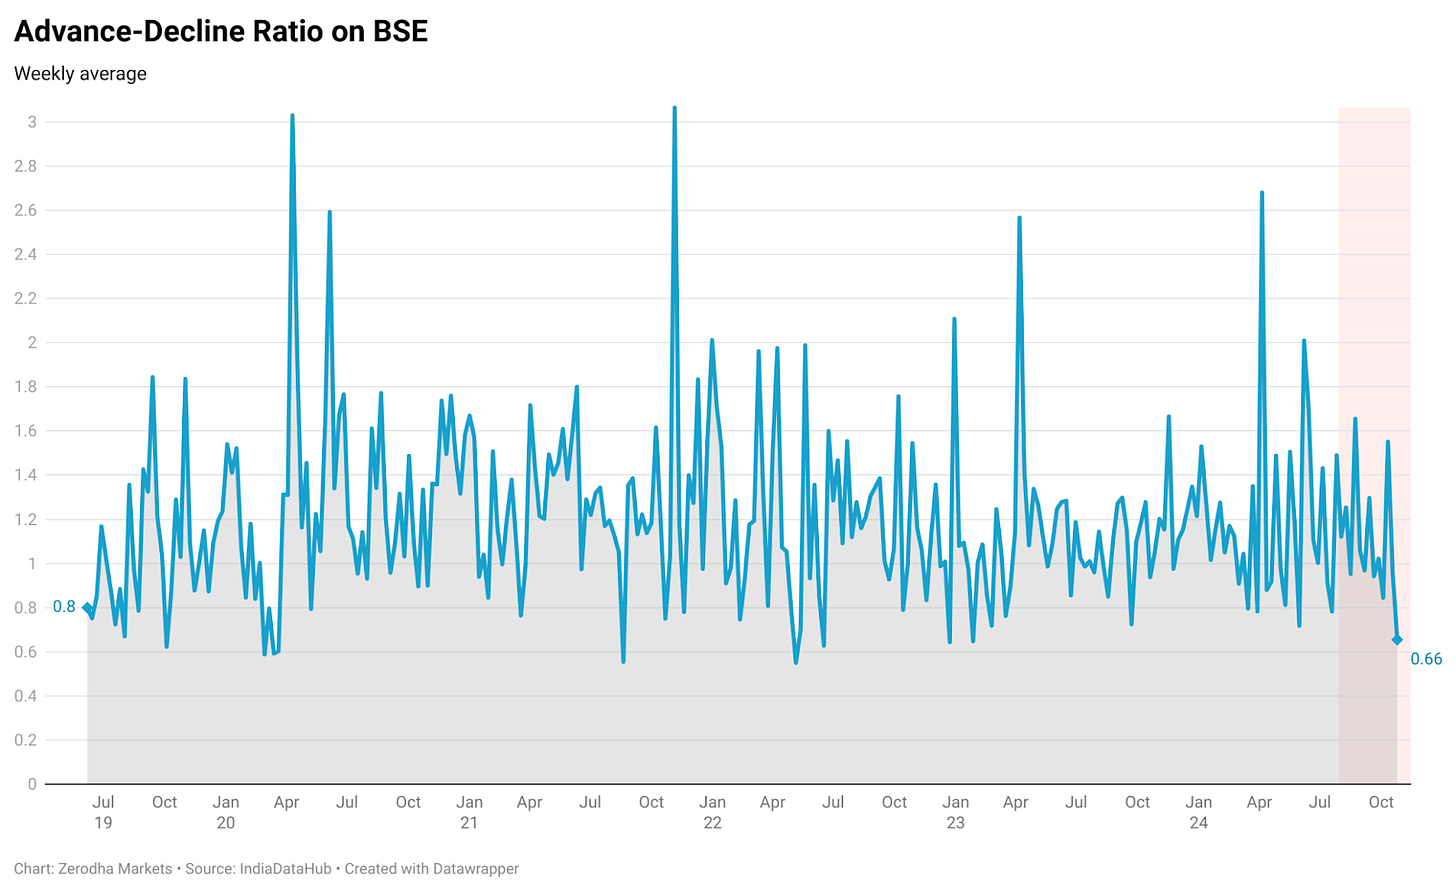
Another way to look at market breadth is through the advance-decline ratio, which compares the number of stocks that went up versus those that went down over a certain period. A ratio above 1 means more stocks are rising, while below 1 suggests the opposite. Right now, the ratio is at 0.6, showing that more stocks are falling than rising.
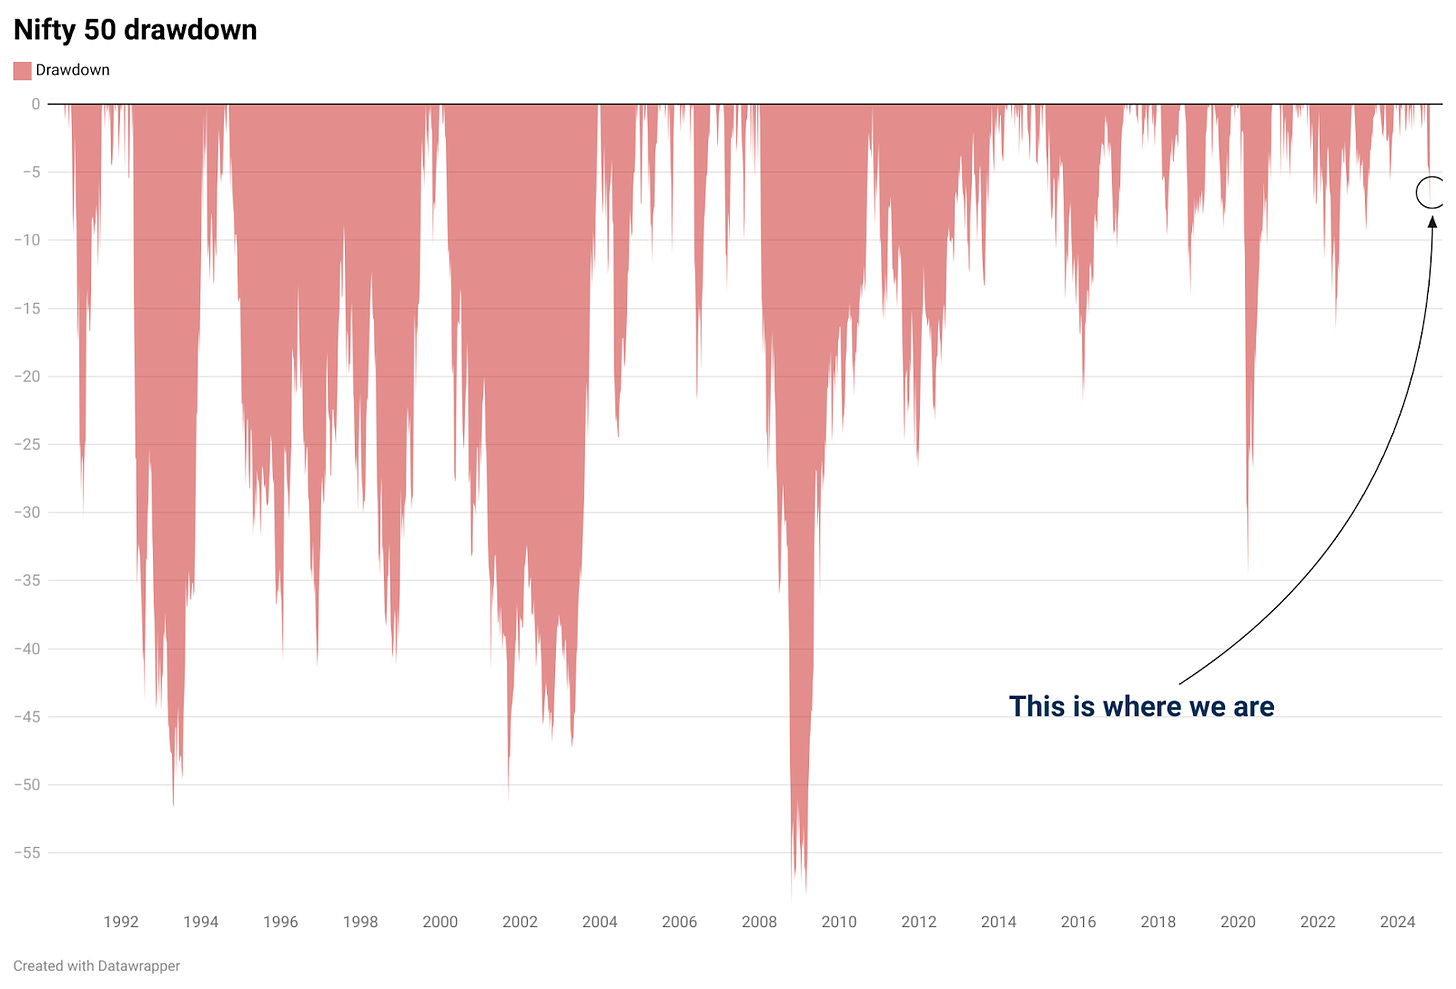
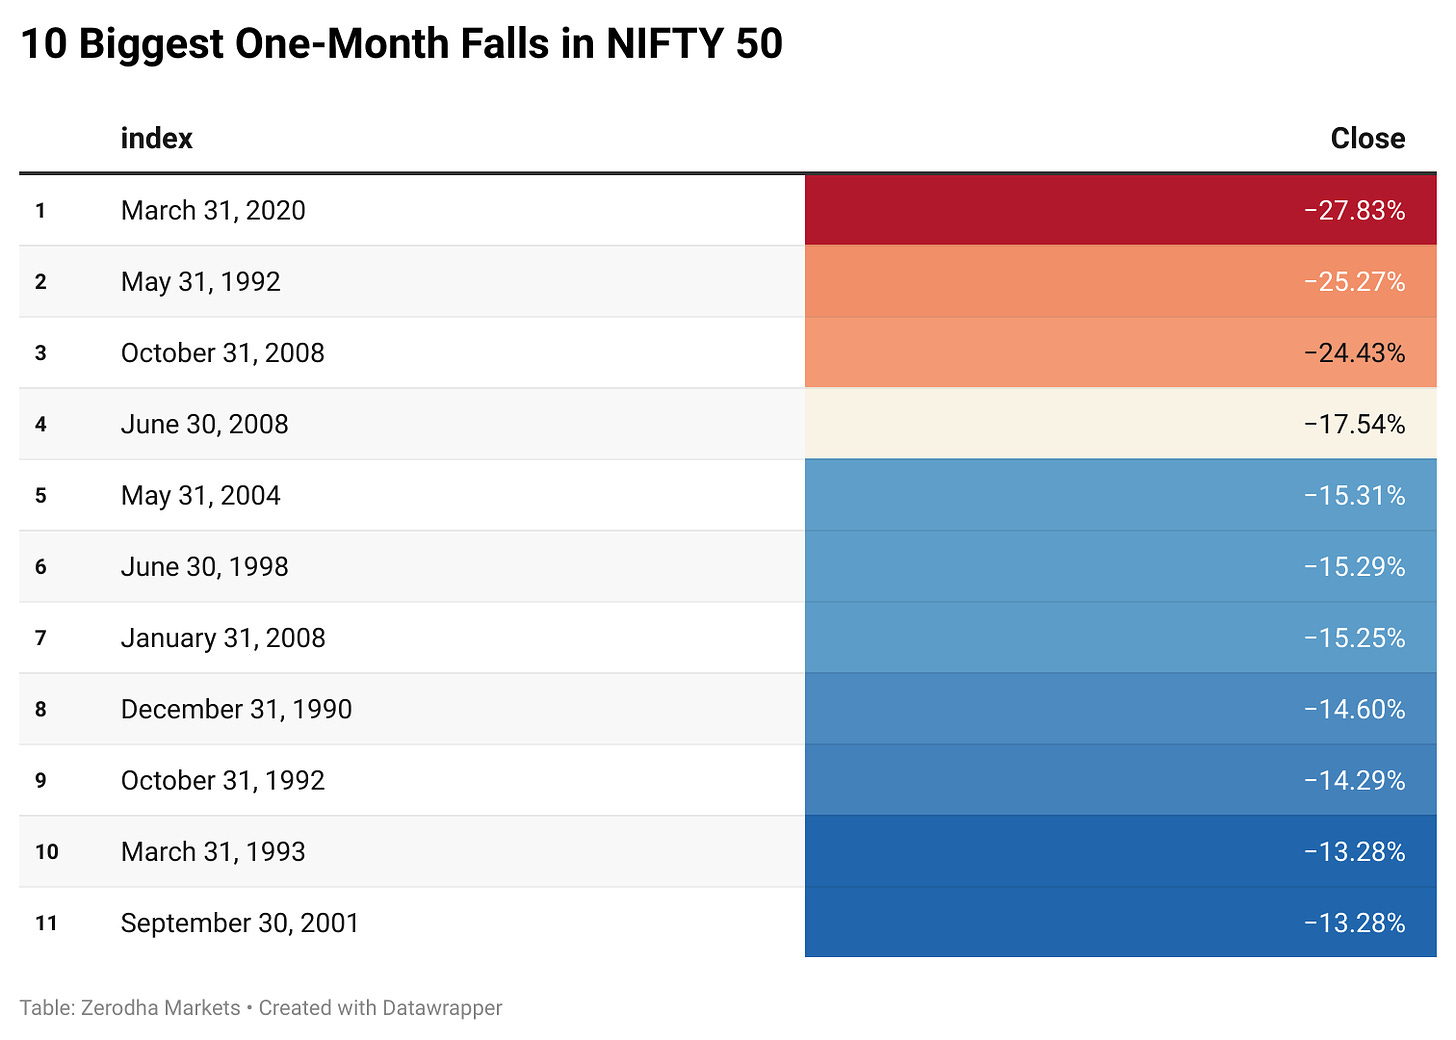
We also checked the Nifty 50 drawdown, which measures how much the index has dropped from its peak. It’s down about 7.8%—the first time we’ve seen such a fall since March 2023. However, even with a 6.5% drop in October 2024, it’s not among the top 10 biggest one-month falls. So, while the drop feels significant, it’s not unprecedented.
Given that the markets have been on a smooth upward run, this correction isn’t entirely unexpected. But of course, nobody can predict what will happen next.
Mutual fund cash holdings
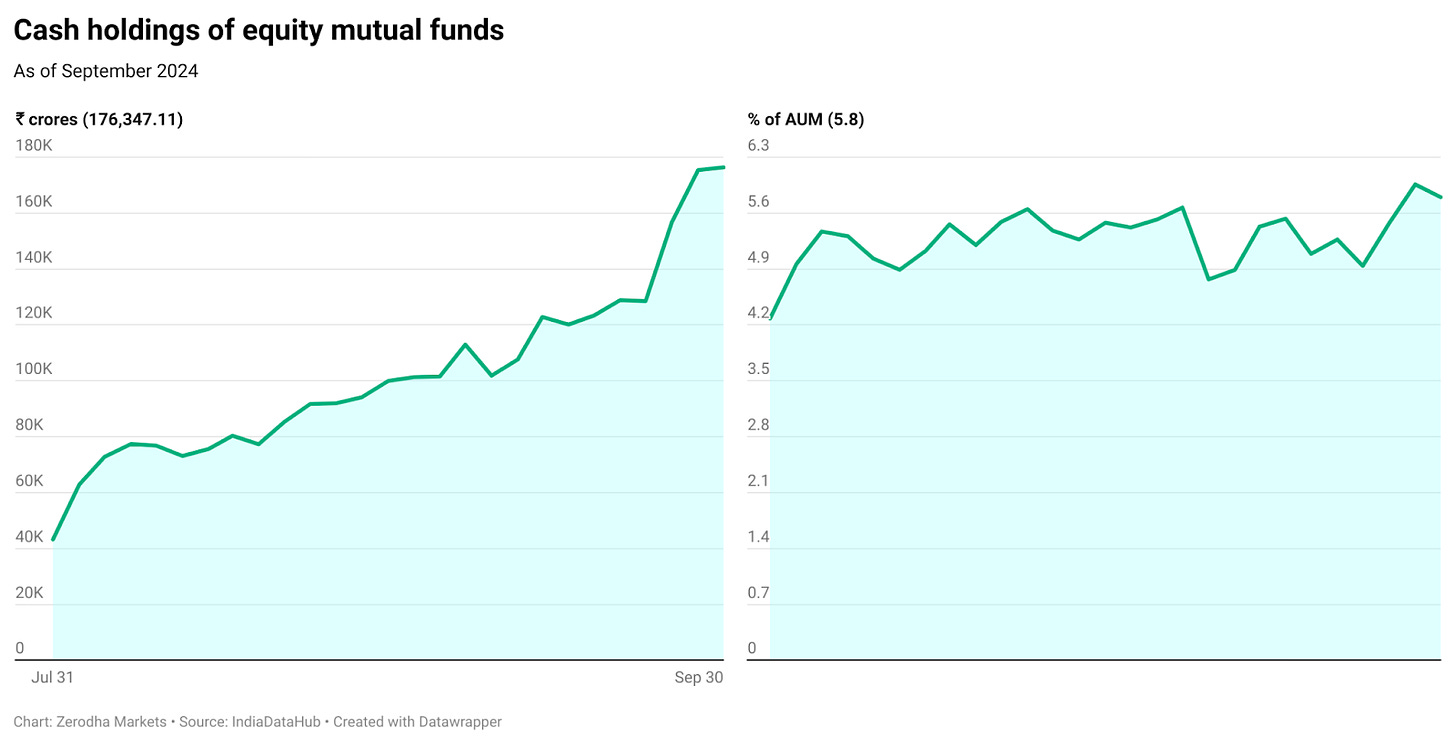
A question we got on Twitter (we like to call it Twitter instead of X) from Akshay was: How much cash are mutual funds holding? As of September 2024, mutual funds had about ₹1.76 lakh crores in cash—roughly 5.8% of the total equity AUM.
Before you start thinking, “If mutual funds invest all this cash, Nifty will hit 50,000!”—hang on. Mutual funds usually hold around 5% in cash to handle redemptions without needing to sell off stocks. Some funds hold more, like the Parag Parikh Flexi Cap Fund, which has 18% of its portfolio in cash, but that’s an outlier.
With Nifty down in October, it’s likely that mutual funds will put some of that cash to work.
Pessimistic foreigners
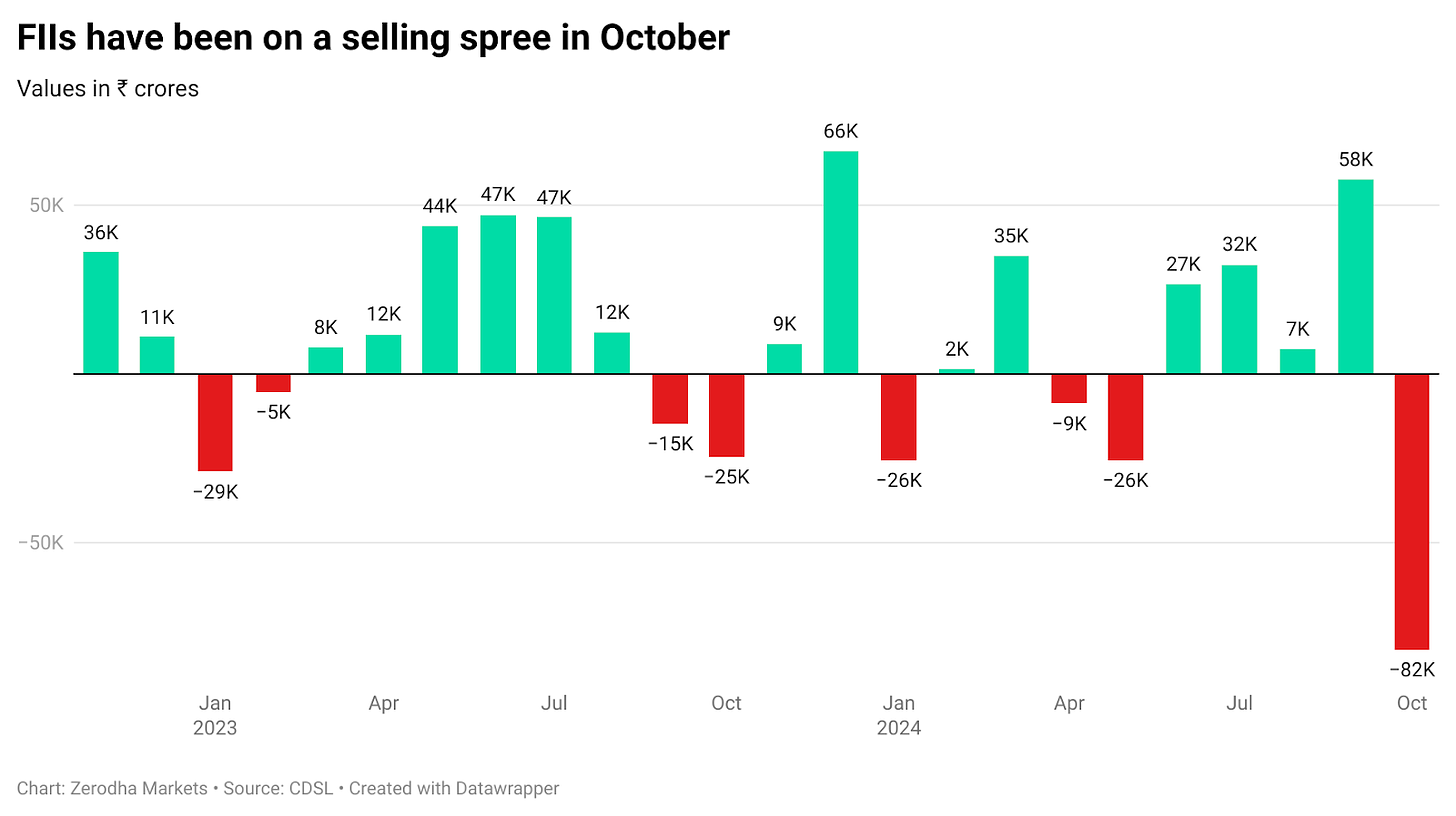
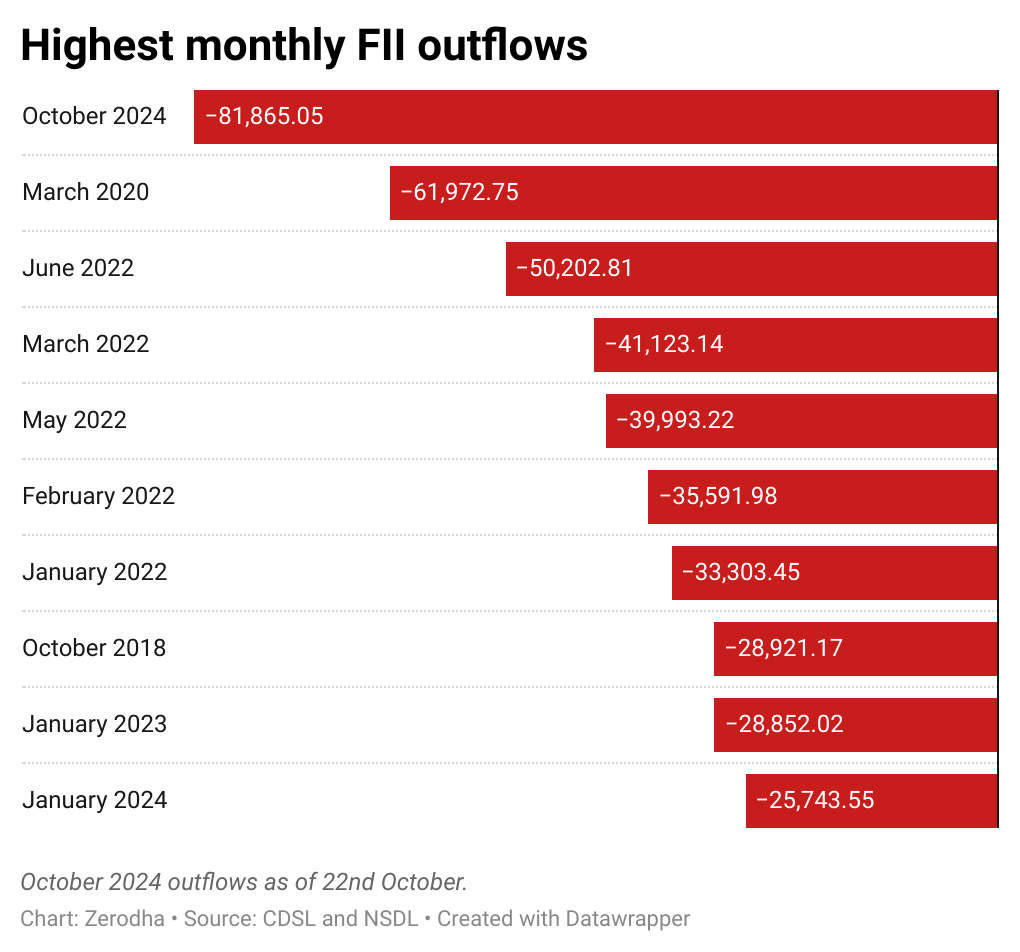
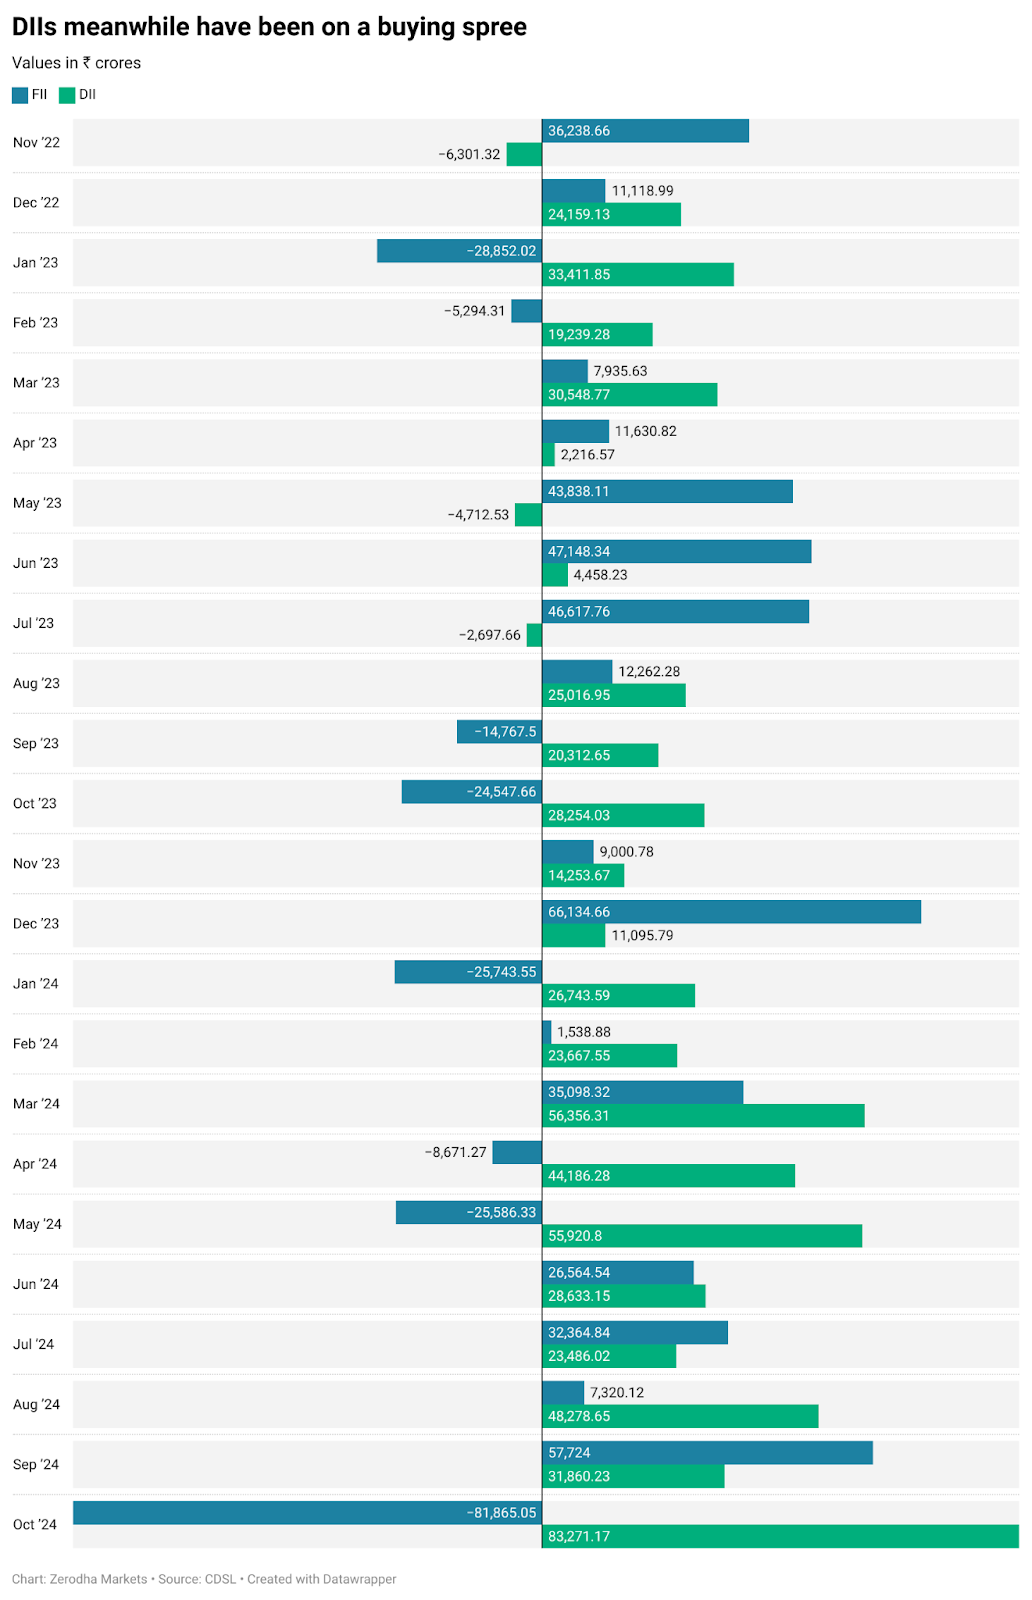
Foreign Institutional Investors (FIIs) were net buyers for most of 2024—six out of the first nine months saw inflows. But October was different. As of October 22, FIIs sold ₹82,000 crores worth of stocks, the biggest monthly outflow ever, even surpassing the COVID-19 sell-off in March 2020.
Despite this, markets didn’t crash, thanks to Domestic Institutional Investors (DIIs), like mutual funds, insurance companies, and pension funds. They bought ₹83,000 crores worth of stocks, balancing the FII outflows.
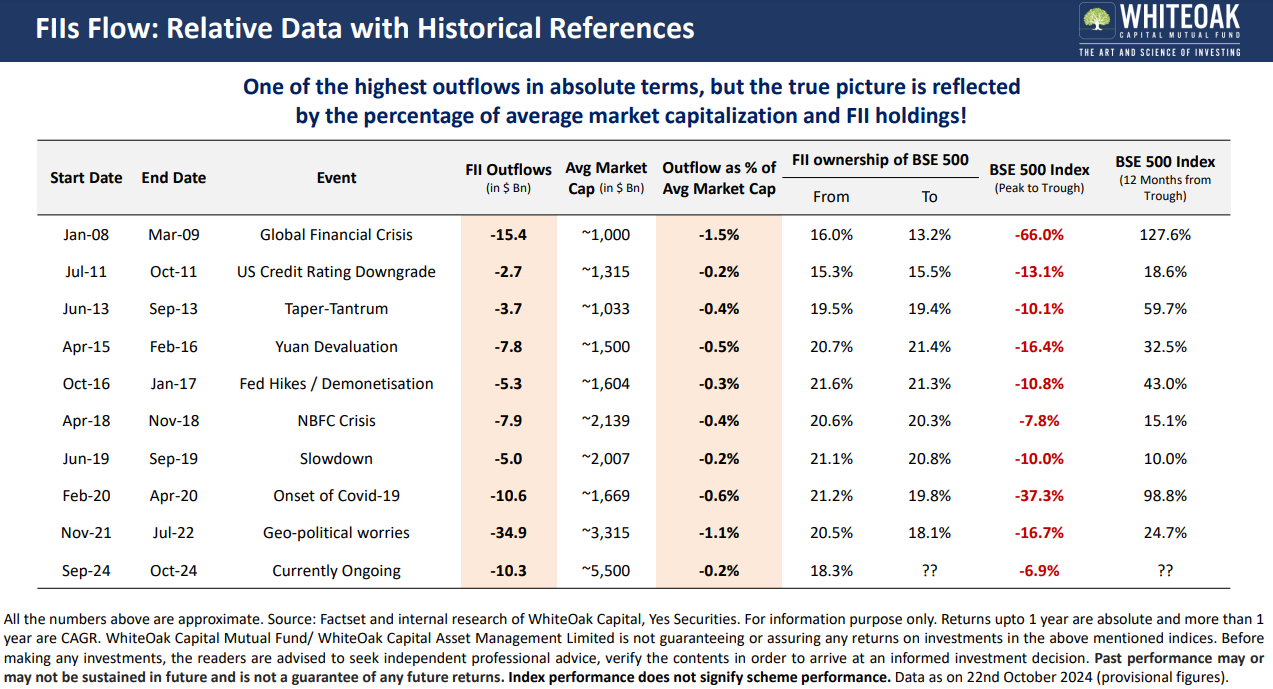
Interestingly, though, while these numbers seem huge, they only amount to 0.2% of the Indian stock market’s market cap. During the 2008 financial crisis, FII outflows were 1.5%—so things could be worse.
Source: WhiteOak MF
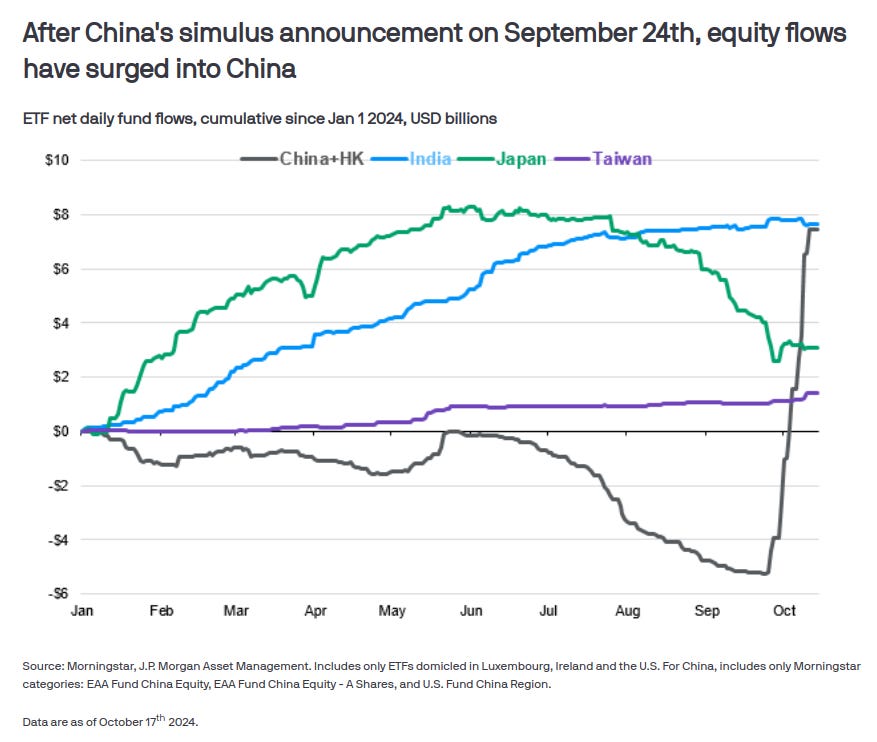
The big question: Why are FIIs pulling out? It could be valuations, global economic issues, disappointing corporate earnings—or China’s stimulus package, which is attracting global investors.
Source: JP Morgan
Start of hard times?
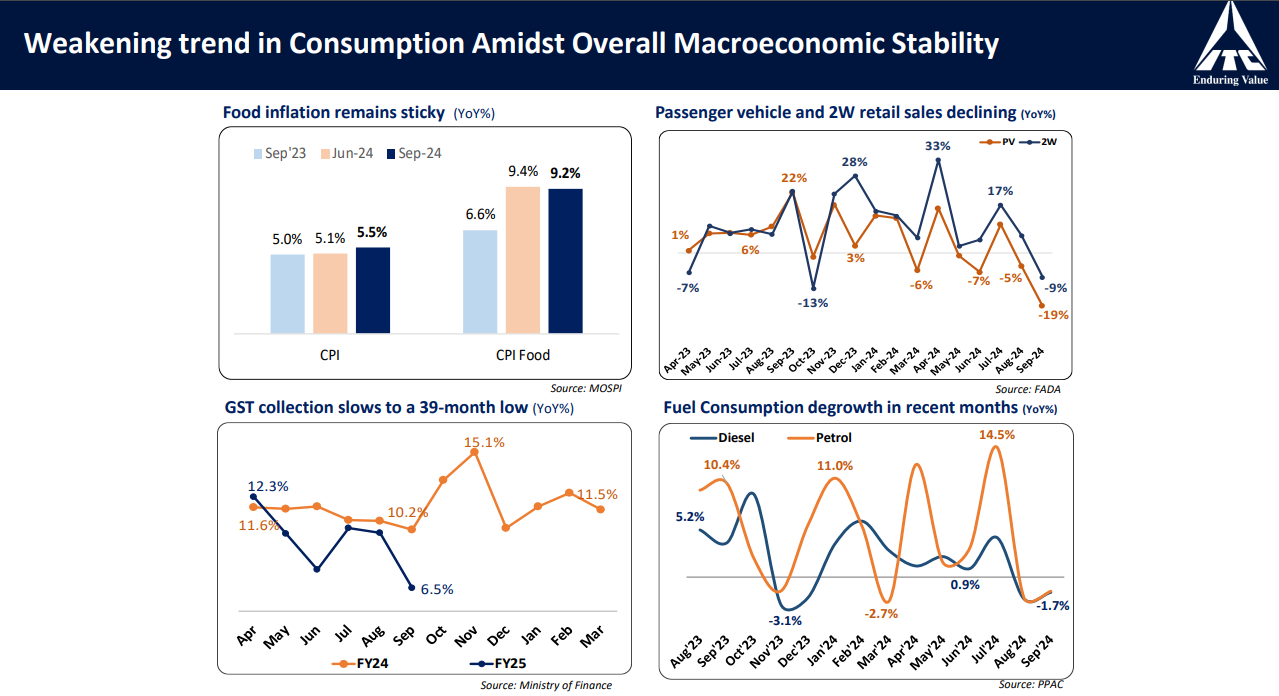
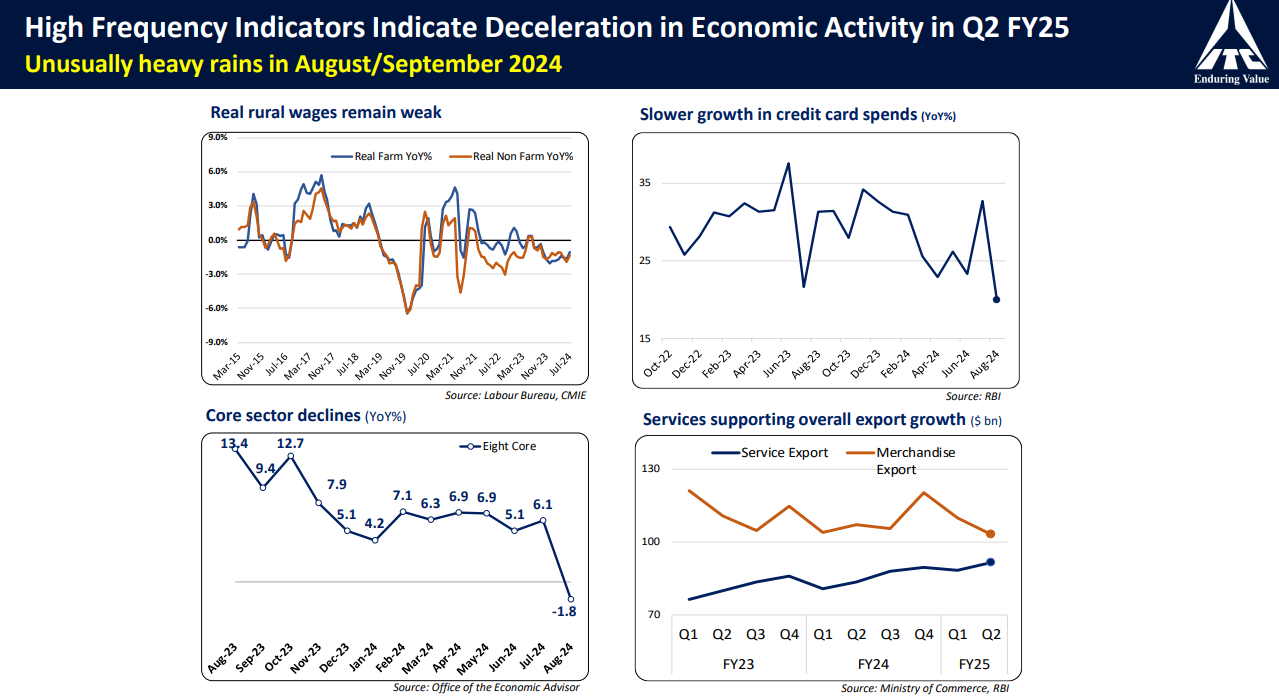
ITC shared some interesting macroeconomic trends in its quarterly presentation, and things look worrying.
- High food inflation is putting pressure on household spending. Excluding a couple of outliers in July and August, food inflation has stayed above 7% for most of the year.
- There’s also a noticeable split between urban and rural consumption. Urban demand seems to be slowing, based on weak real estate sales, passenger vehicle sales, and FMCG company earnings. On the other hand, rural demand is picking up, helped by good monsoons, rising tractor sales, and lower MNREGA employment numbers.
Debt mutual funds hit a bump, equity remains strong
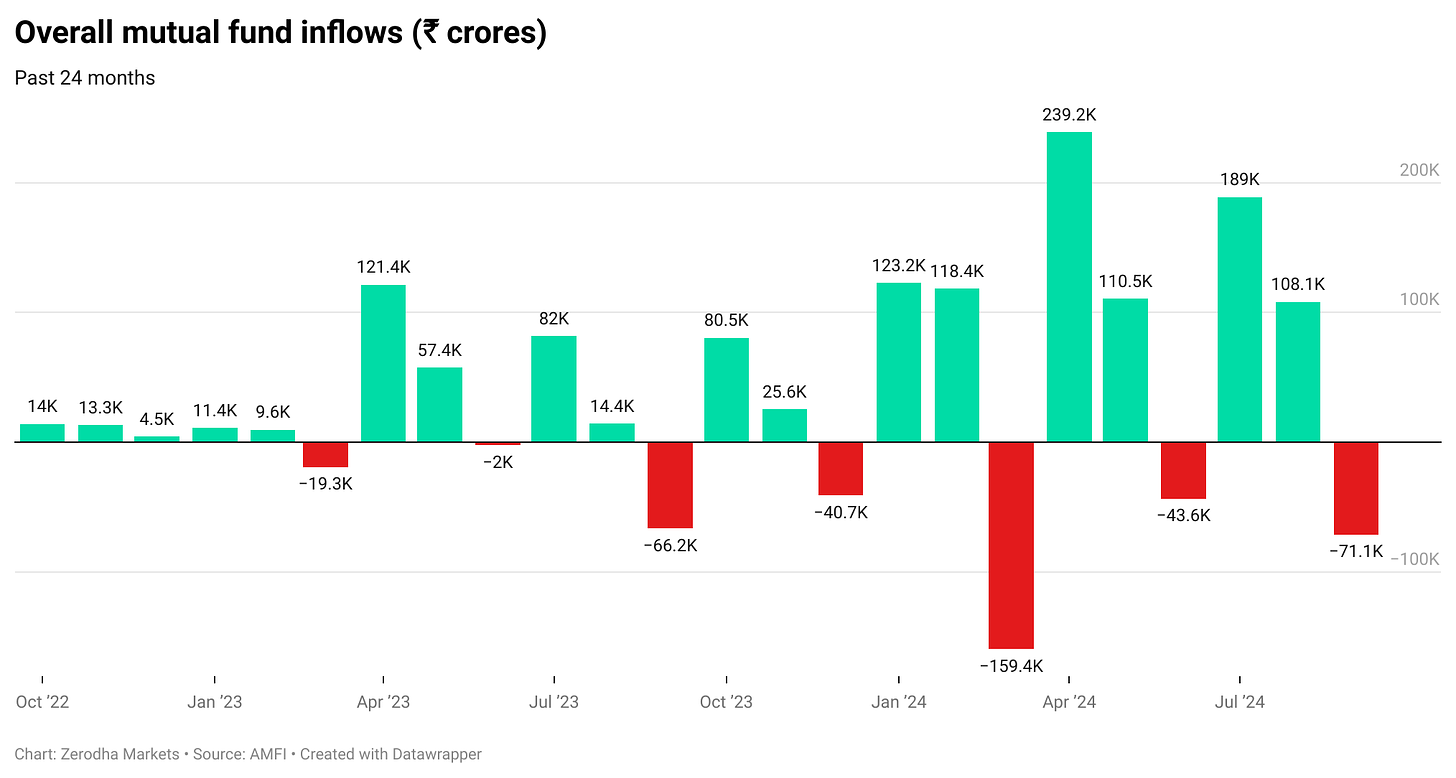
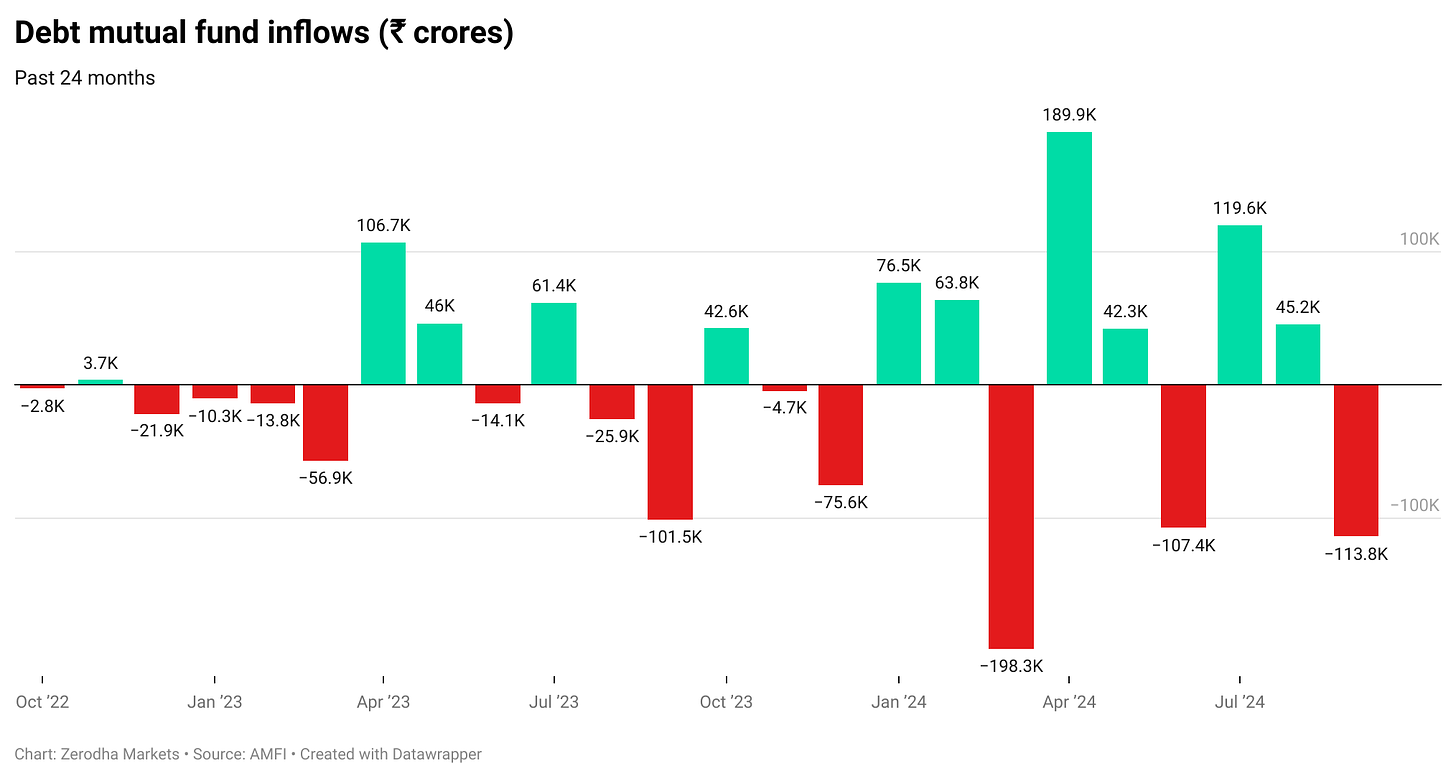
The mutual fund industry saw outflows of ₹71,000 crores in September, driven by ₹1.13 lakh crores exiting debt funds.
Why did this happen? Companies use debt funds to park their cash, and they often pull out money at the end of every quarter to pay advance taxes. That’s why we see similar outflows every June, September, December, and March.
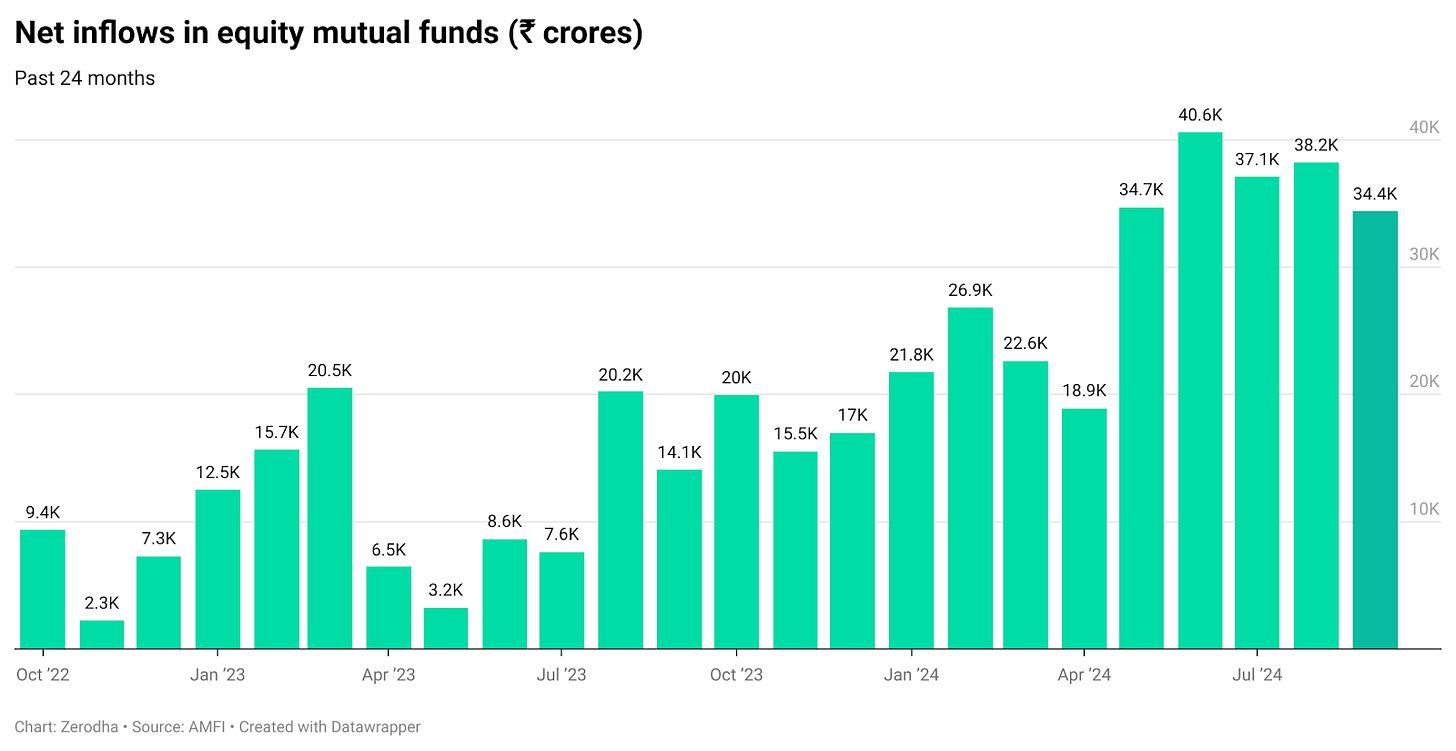
If we ignore October, the Indian equity markets have been steadily rising this year, with only a few minor hiccups along the way. This is reflected in the net inflows into equity mutual funds—so far, about ₹2.75 lakh crores have flowed in. The last five months, in particular, have seen consistent inflows of over ₹34,000 crores each month.
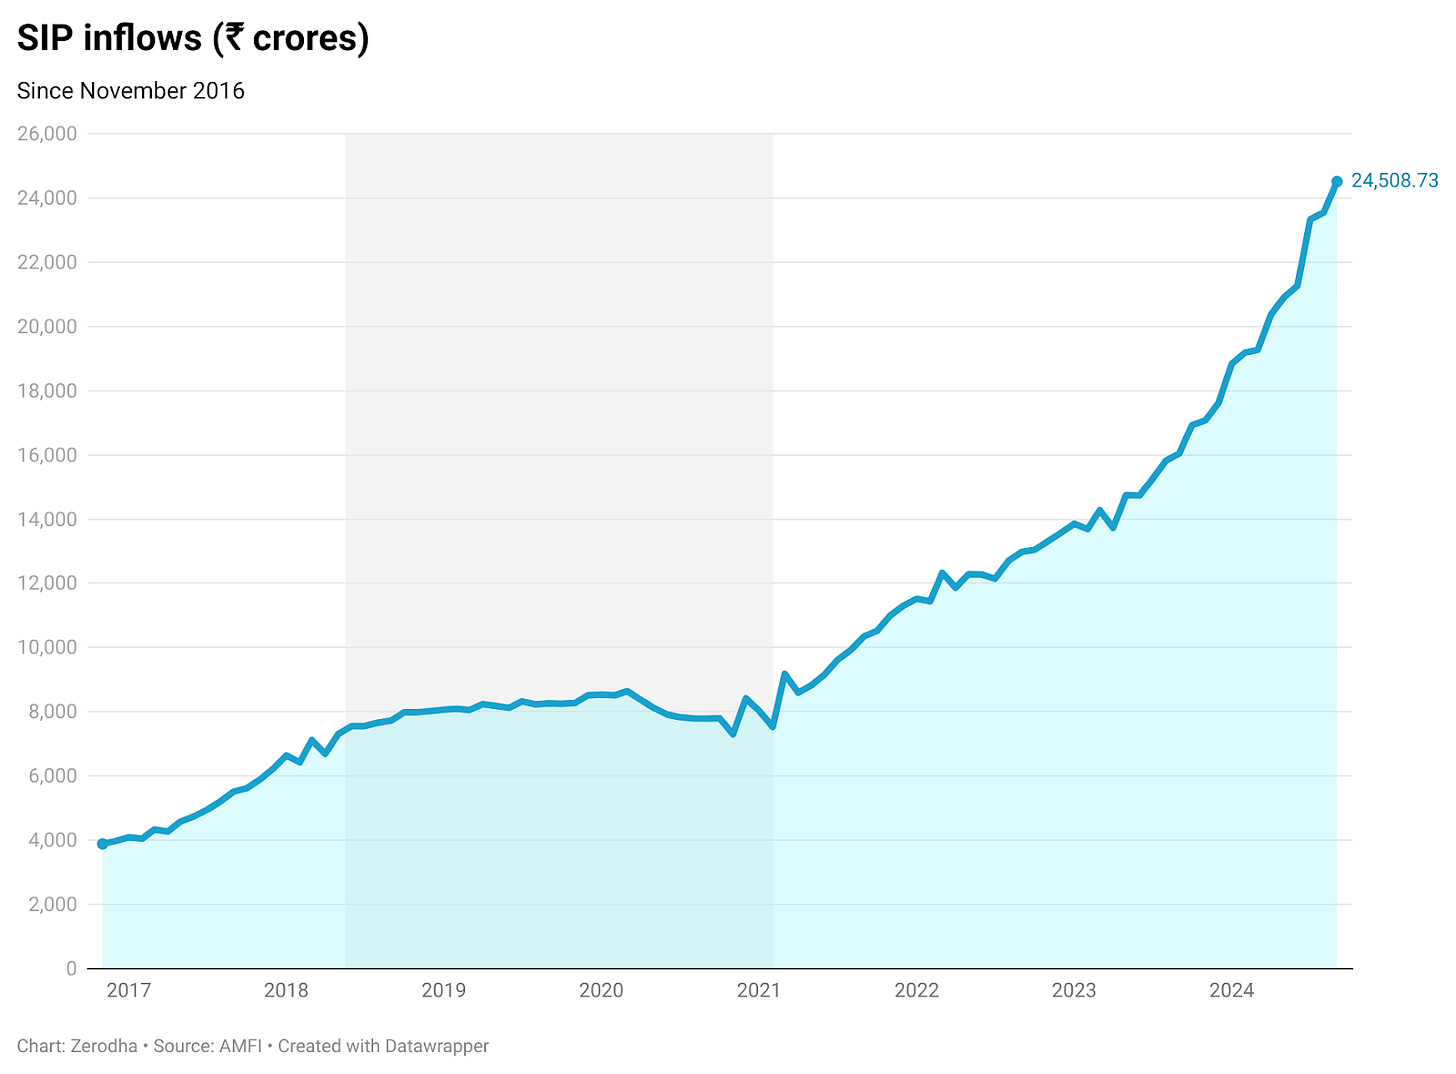
Although we don’t have net SIP inflow numbers, gross inflows (before accounting for redemptions) have been steadily rising since 2021, hitting new highs almost every month—mirroring the massive bull run in Indian markets.
While this is great for both the markets and investors, it’s yet to be seen if the same enthusiasm will hold if the markets face a significant correction or go through a prolonged period of stagnation.
When markets are hitting new highs, like IPOs even NFOs join the party—September marked the fifth consecutive month with NFO collections exceeding ₹10,000 crores.
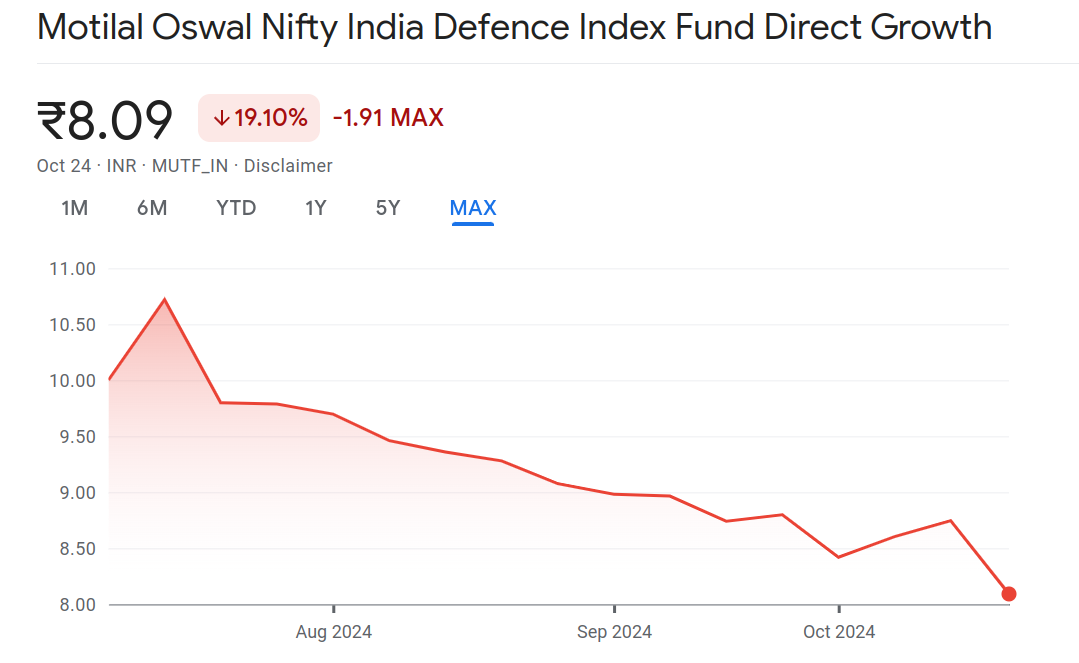
Most of these new mutual fund schemes are thematic funds focused on specific sectors or themes like defense, electric vehicles, consumption, or commodities. These funds tend to perform well when the broader markets are strong, but they can struggle for extended periods during downturns. We may already be seeing signs of this in some overhyped themes, like defense.
Big IPOs, big listing …
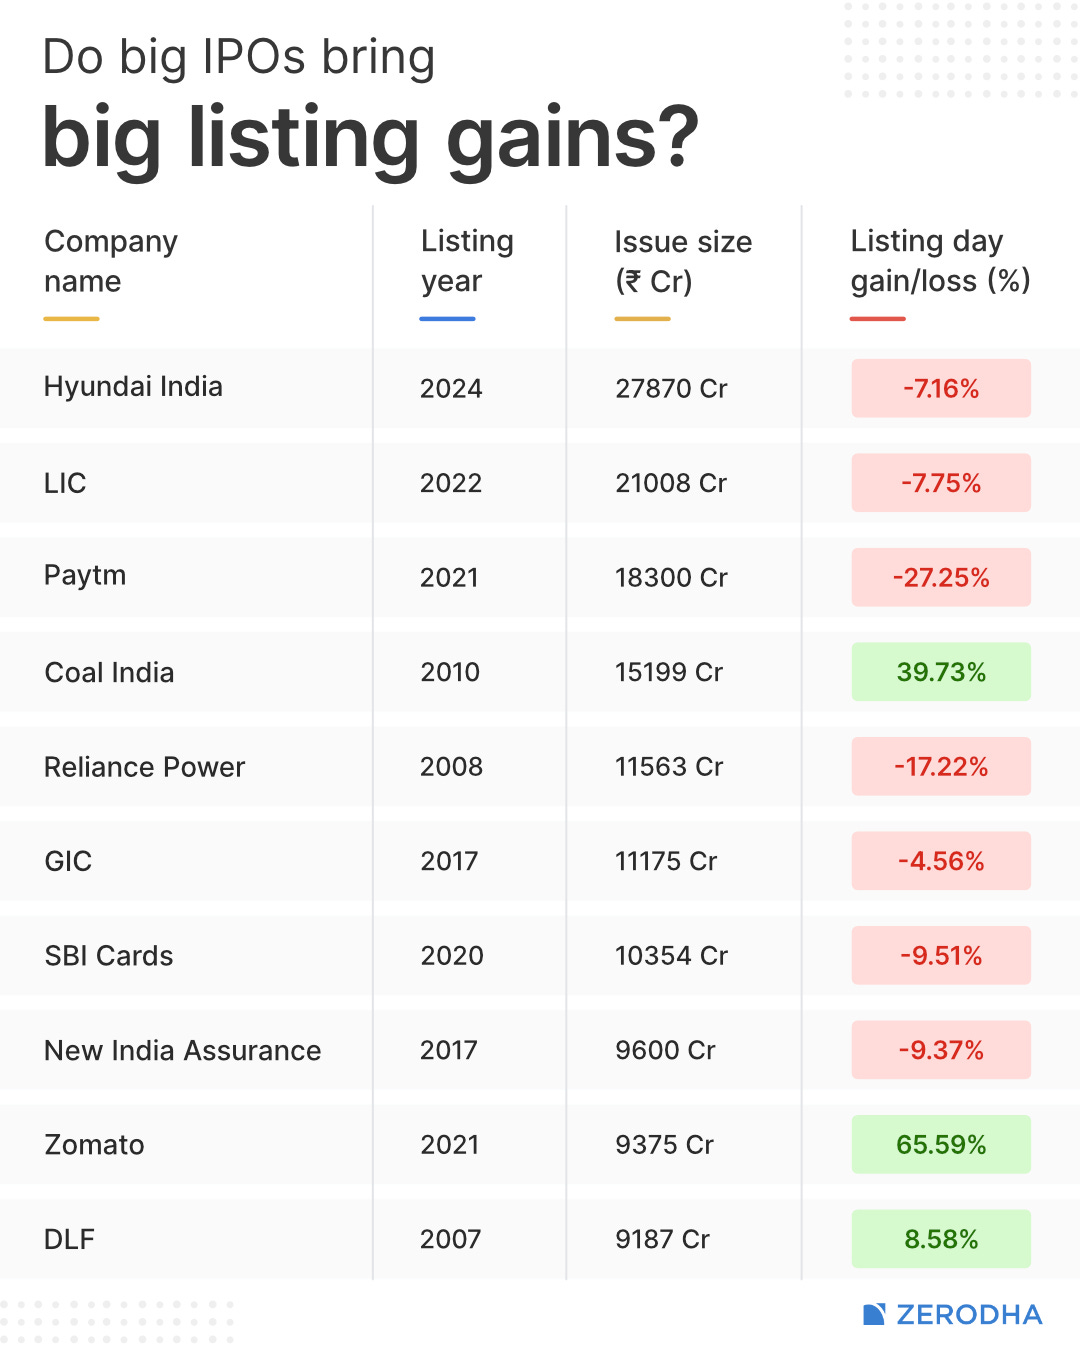
Hyundai Motor India recently launched the biggest IPO in India’s history. However, retail investors weren’t too enthusiastic—it only got 50% of the expected retail subscriptions. Thanks to institutional investors, it still sailed through, but the stock ended down 7% on listing day.
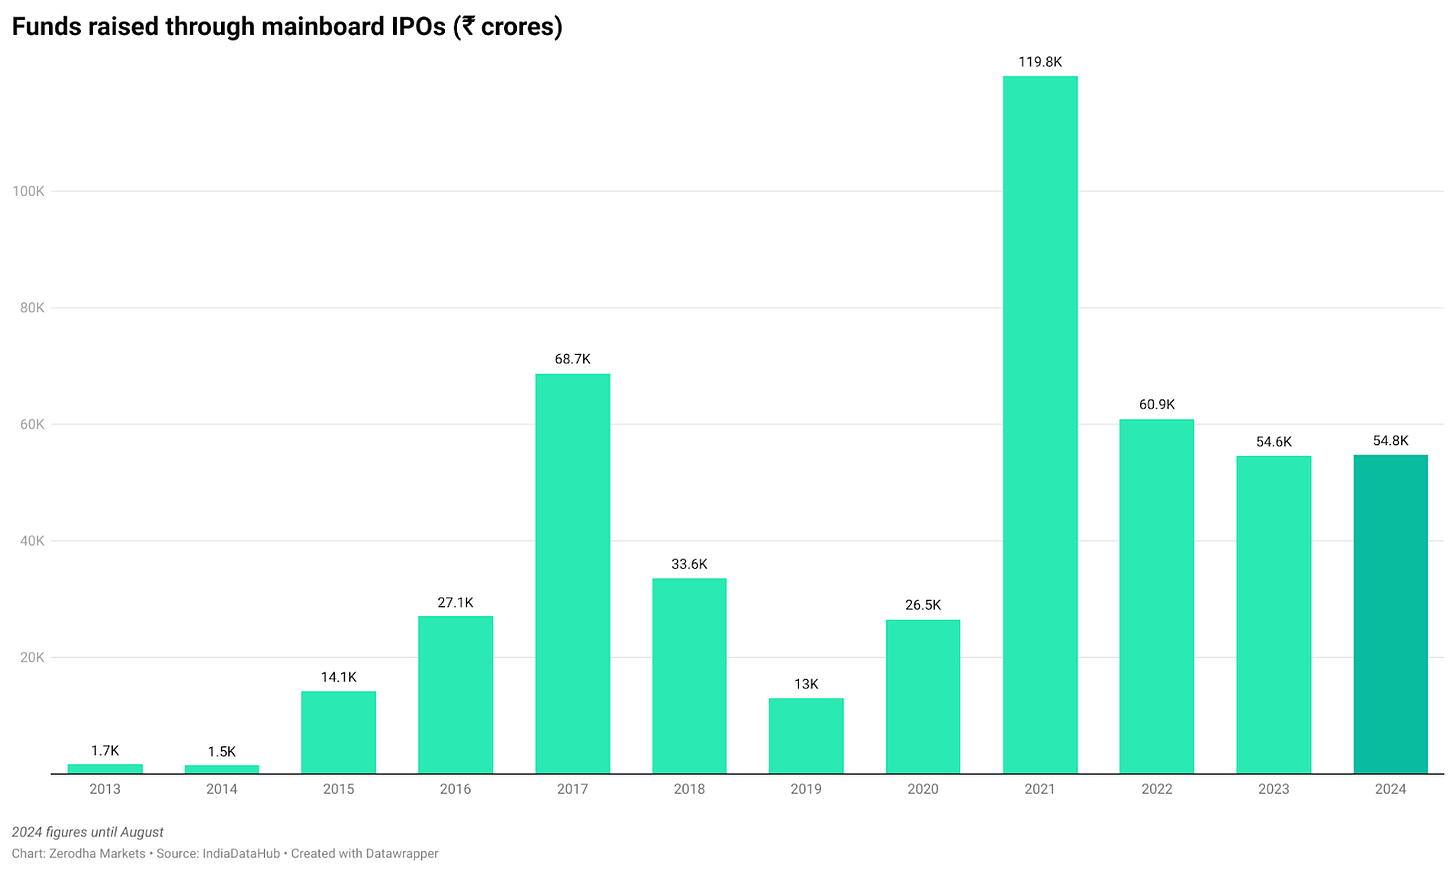
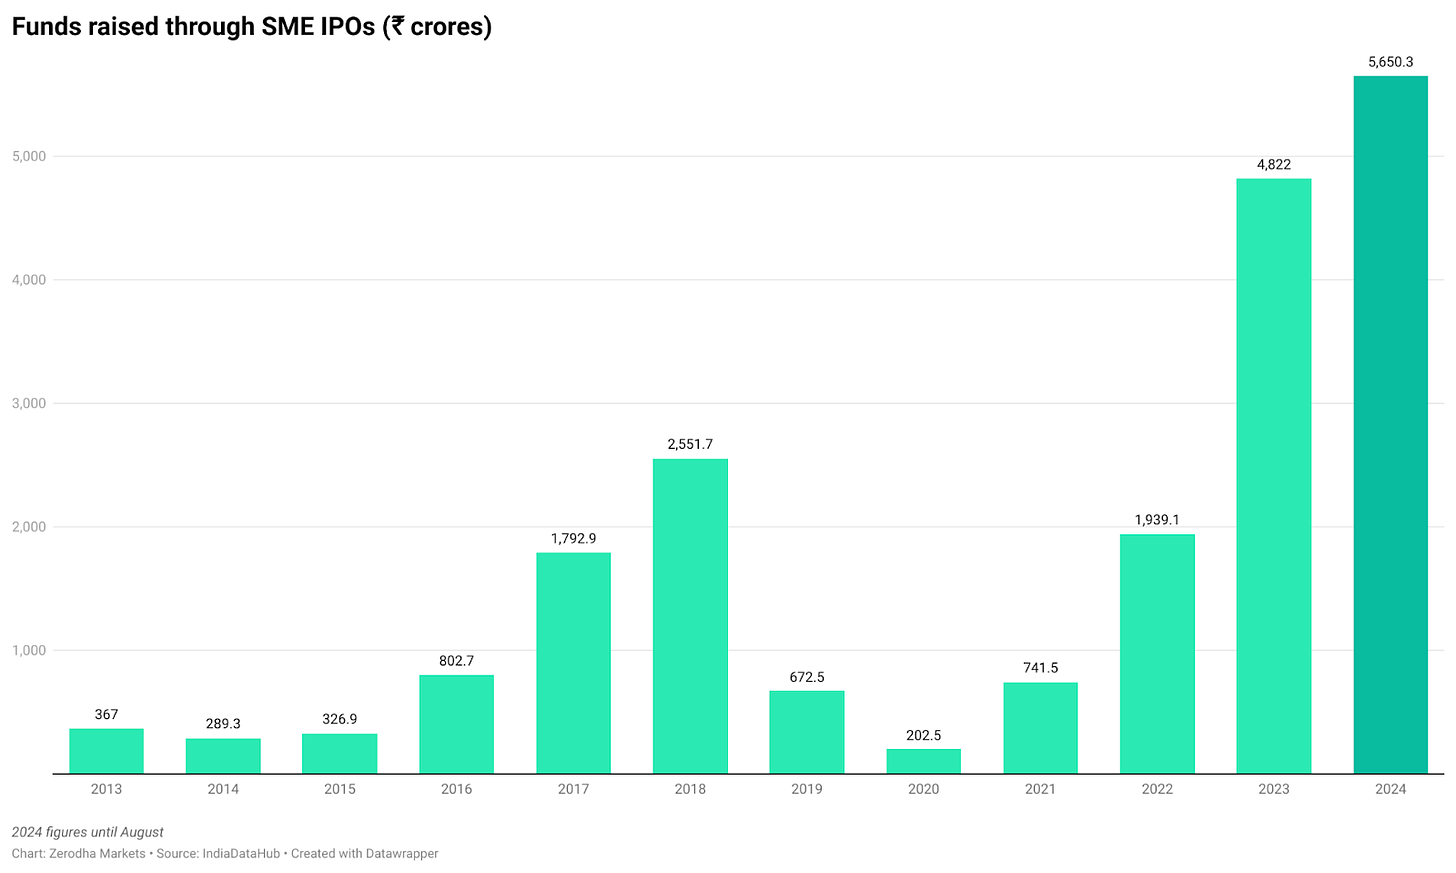
Even with some lackluster listings, companies have raised ₹54,000 crores from IPOs so far in 2024, making it a bumper year for fundraising. The SME platform also had a record year, with SMEs raising ₹5,600 crores by August.
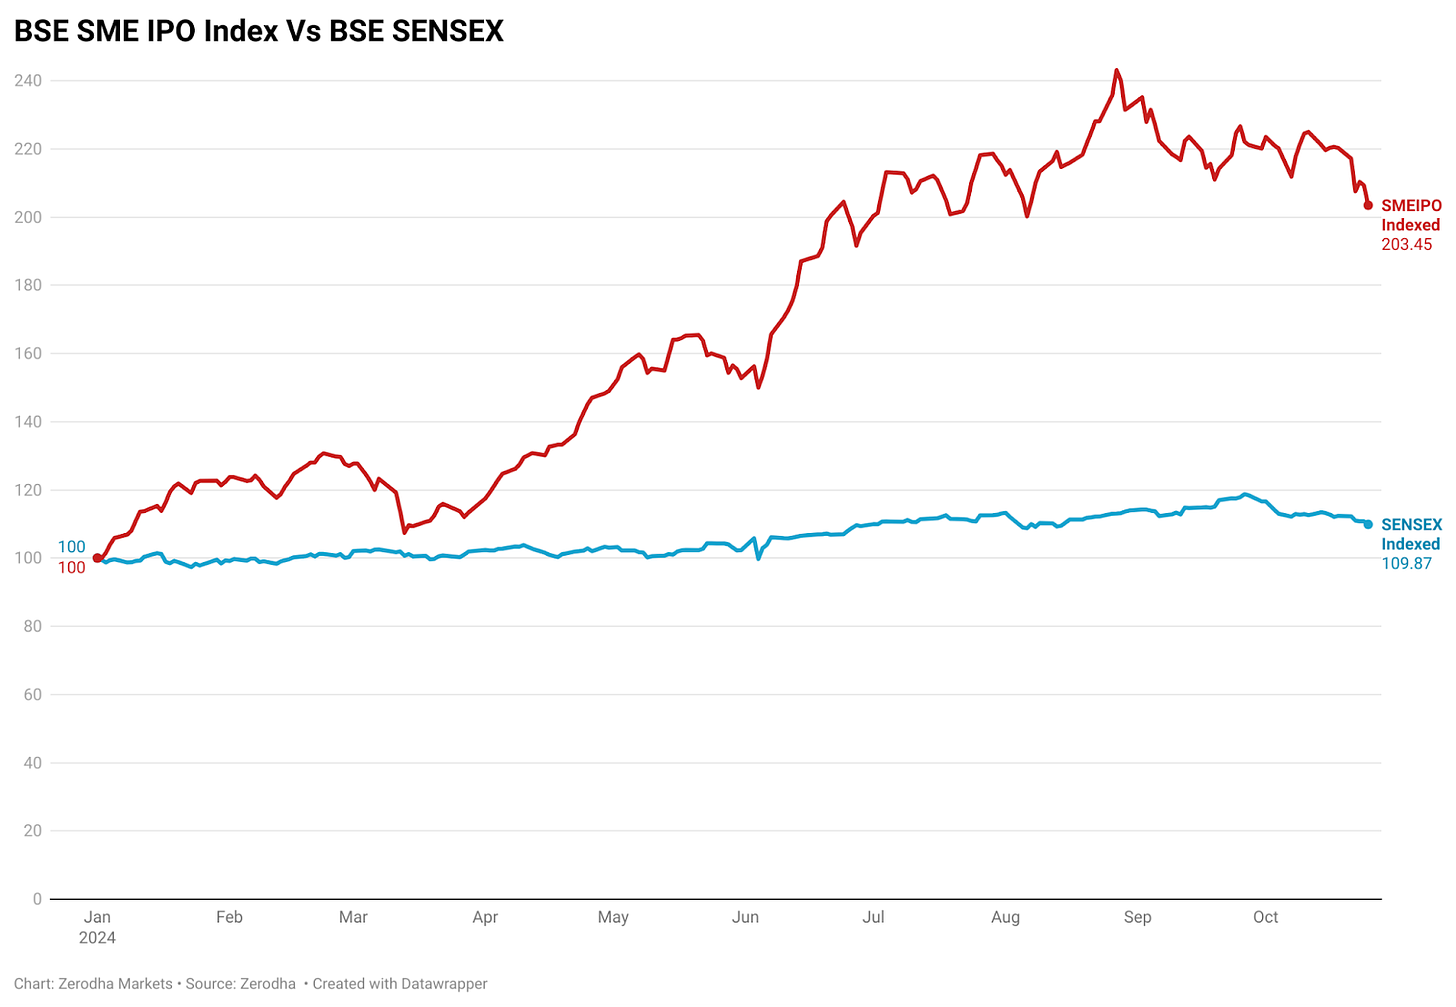
This is all thanks to the raging bull market we’re in and it shows in the numbers. The BSE SME IPO index is up 100% year to date while the Sensex is up 10%.
Changing investor demographics
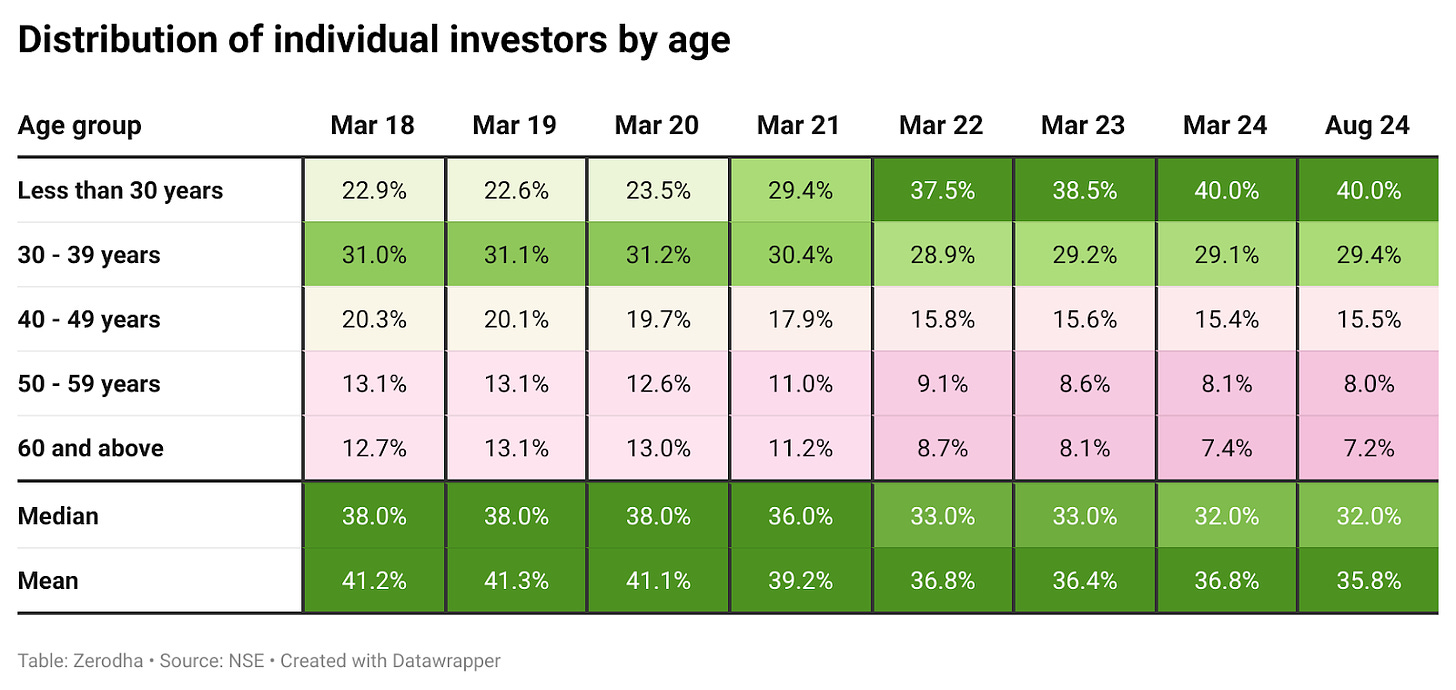
Post-COVID-19 pandemic years have been a boom for markets, and we don’t mean that in terms of appreciation in asset prices. Over the last few years, Indian markets have seen a massive increase in participation from young investors–those less than 30 years old. Before the pandemic this number was around 23%, it has almost doubled to ~40% as of August 2024.
The love for gold
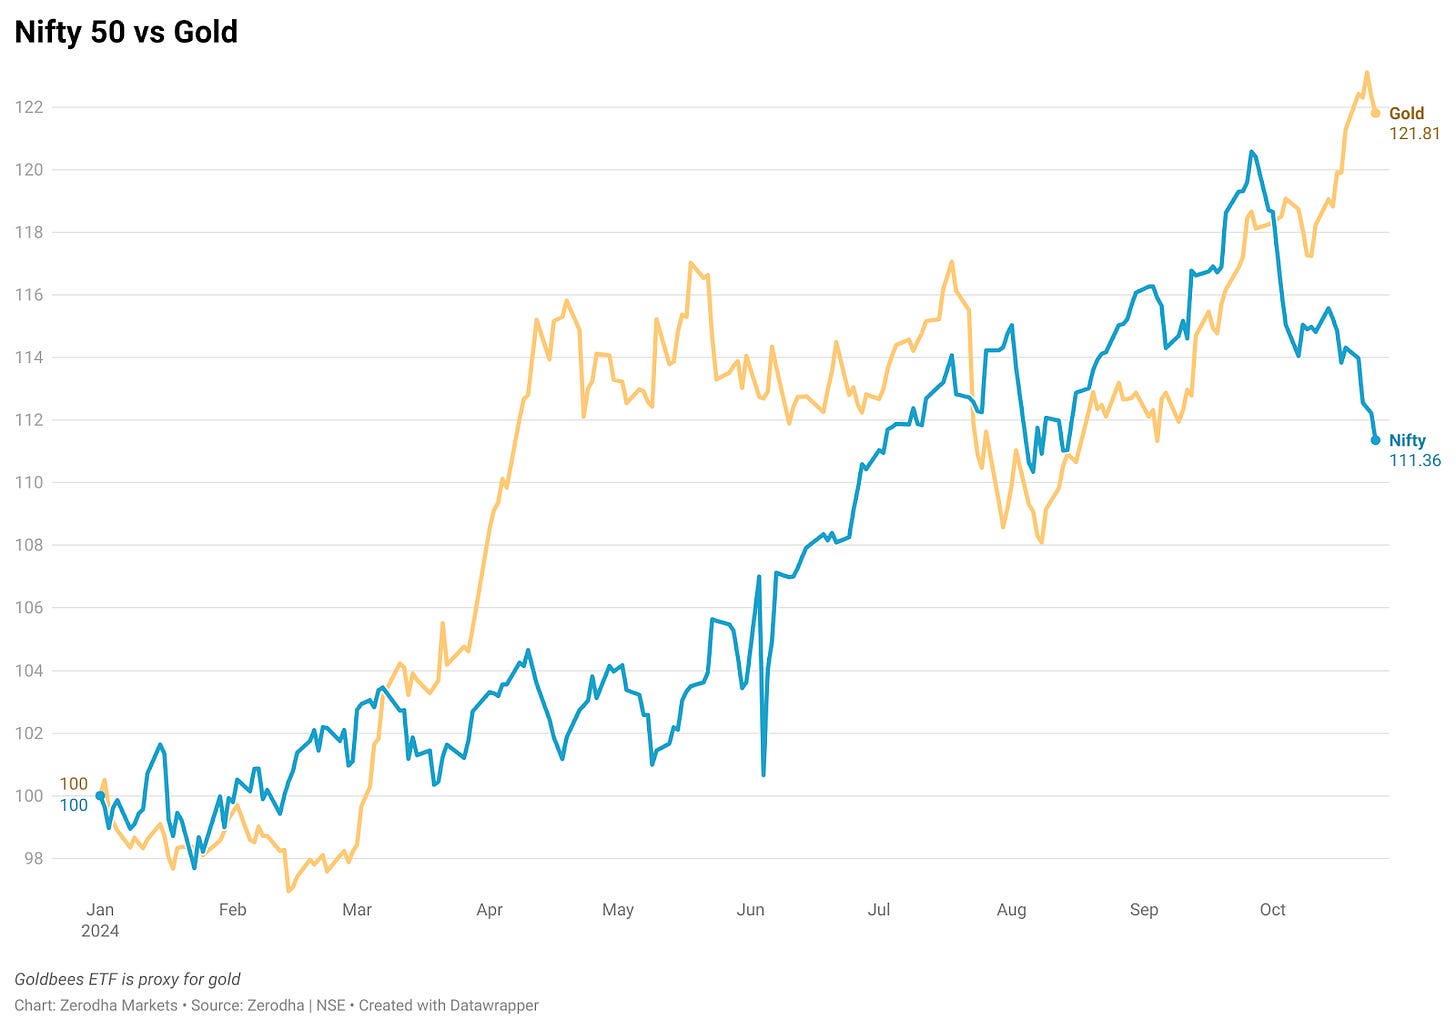
Gold has been on a stellar run. After trading sideways from 2021 to the end of 2022, it broke out and has since become one of the top-performing asset classes. This year alone, gold is up 22%, compared to Nifty’s 11% gain.
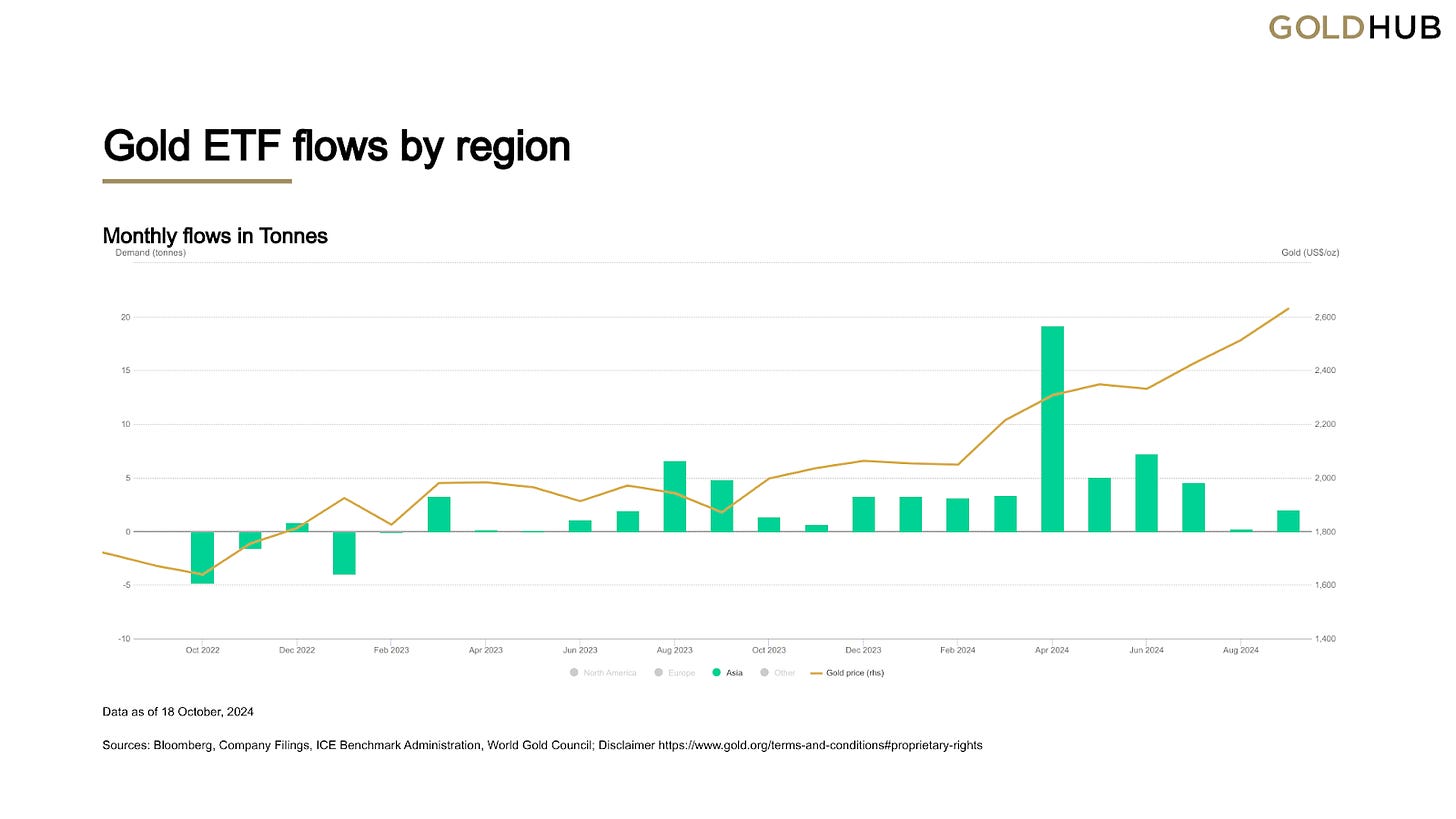
The inflows reflect this momentum—gold ETFs have seen steady inflows since 2023, accelerating in 2024. So far this year, gold funds have attracted ₹7,200 crores.
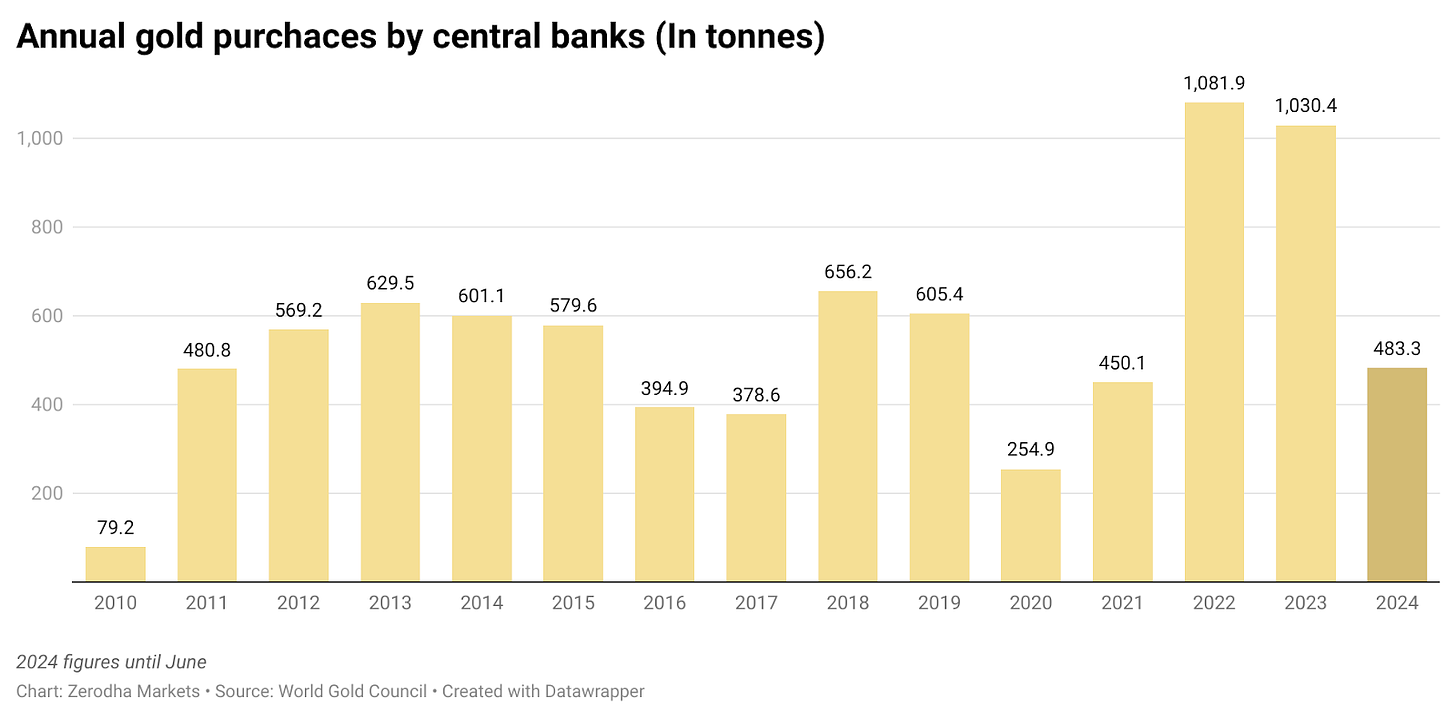
And it’s not just retail investors—central banks are all-in on gold . As of Q2 2024, they’ve purchased 484 tons, and at this pace, they could end the year close to 1,000 tons. In 2023, they added 1,030 tons. The fact that gold has become a top reserve asset shows how central banks view the state of the world.
A recent World Gold Council survey offers some insights: 88% of central banks see gold as a reliable store of value and an inflation hedge, while 82% believe it brings stability during financial crises. With geopolitical tensions rising and inflation still a concern, gold is in high demand.
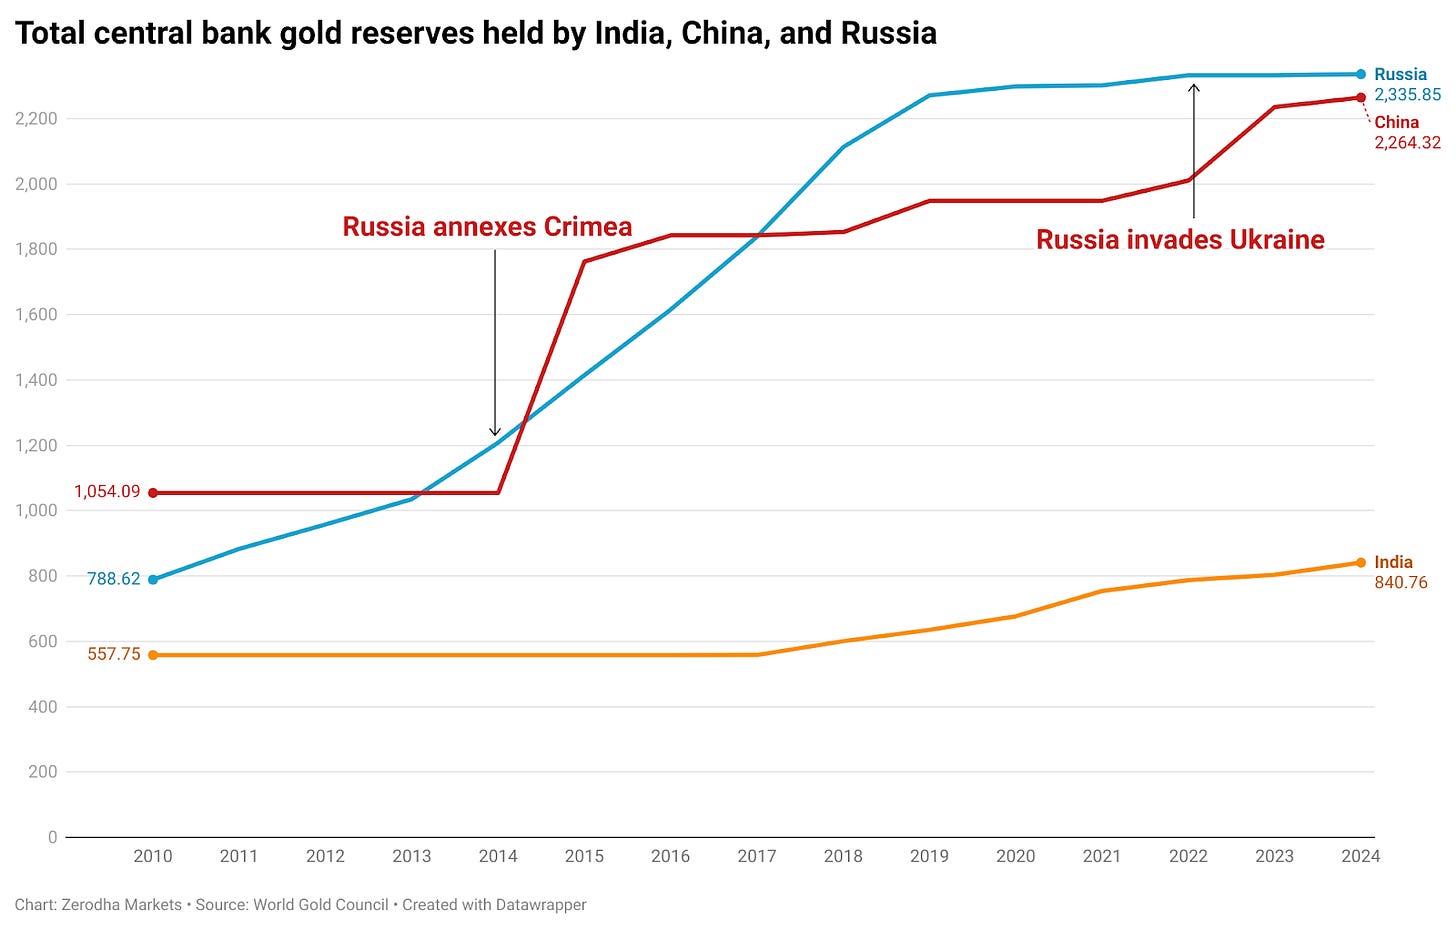
Countries like Russia and China have been building their gold reserves significantly since 2010. Interestingly, even Western central banks are shifting strategies—57% now expect to increase their gold holdings, up from 38% last year.
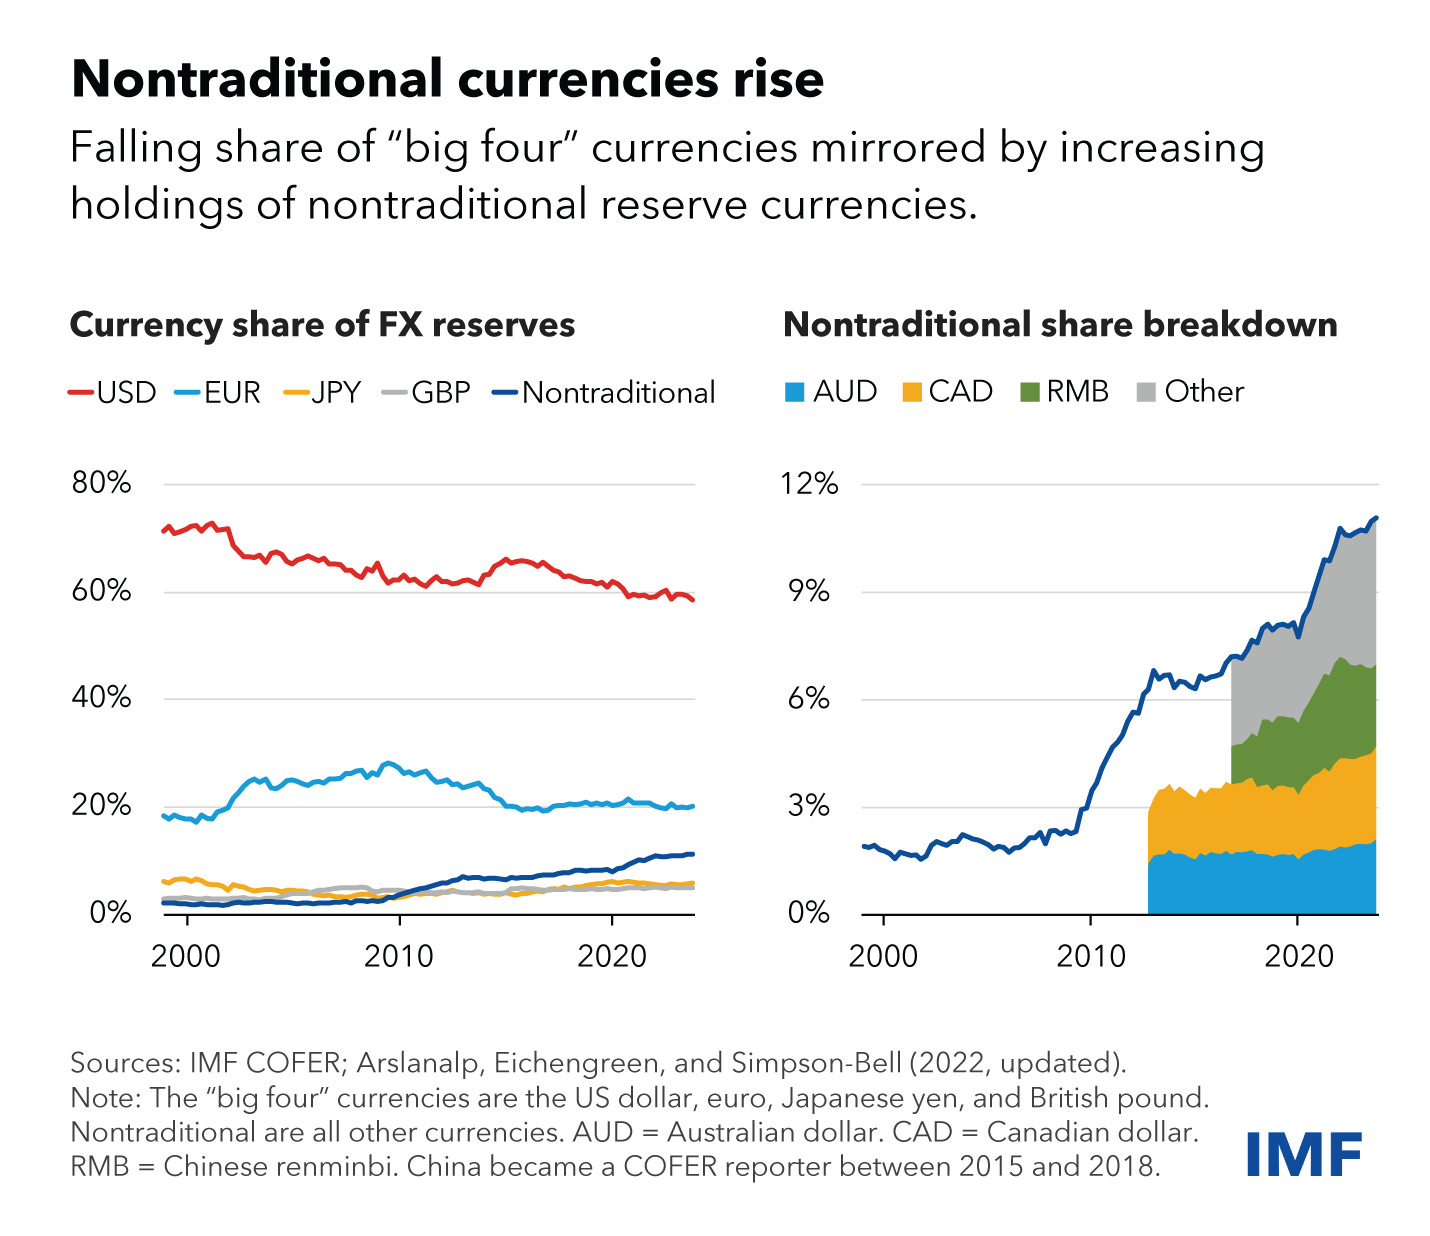
This comes at a time when questions are being raised about the US dollar’s dominance as the global reserve currency. In fact, 62% of central banks believe the dollar’s share in global reserves will decline over the next five years.
Is De-dollarization really happening?
Yes and no. While central banks are adding assets denominated in currencies like the Australian dollar, Canadian dollar, Chinese renminbi, and South Korean won, this isn’t full-scale de-dollarization—it’s more about diversifying reserves. The drop in the dollar’s share hasn’t translated into a significant rise in traditional alternatives like the euro, yen, or pound either.
Will it be Harris or Trump?
The US election is just 10 days away and the race is neck and neck between Donald Trump and Kamala Harris, and it’s anyone’s guess who will win. But since the outcome will have a big impact on both the global economy and India, it’s worth paying attention.
Trump’s economic plan for a possible second term revolves around a few key areas: trade protectionism, tax cuts, deregulation, and energy independence. A major part of his strategy involves overhauling trade policy—he’s proposing universal tariffs of 10% to 20% on all imports, with even higher tariffs of up to 60% on Chinese goods. His goal is to protect American jobs, support local manufacturing, and reduce dependence on foreign products. These moves could have serious ripple effects across the global economy.
Harris, on the other hand, focuses on strengthening the middle class and tackling affordability issues. Her plan includes tax cuts for over 100 million working- and middle-class Americans while lowering costs for essential goods and services. She also plans to raise the corporate tax rate to 28% and increase taxes on high-income earners to fund her initiatives. A big part of her agenda emphasizes industrial policy—boosting American manufacturing and competitiveness in sectors like semiconductors, AI, and clean energy.
Now, let’s look at what some of the polls are saying.
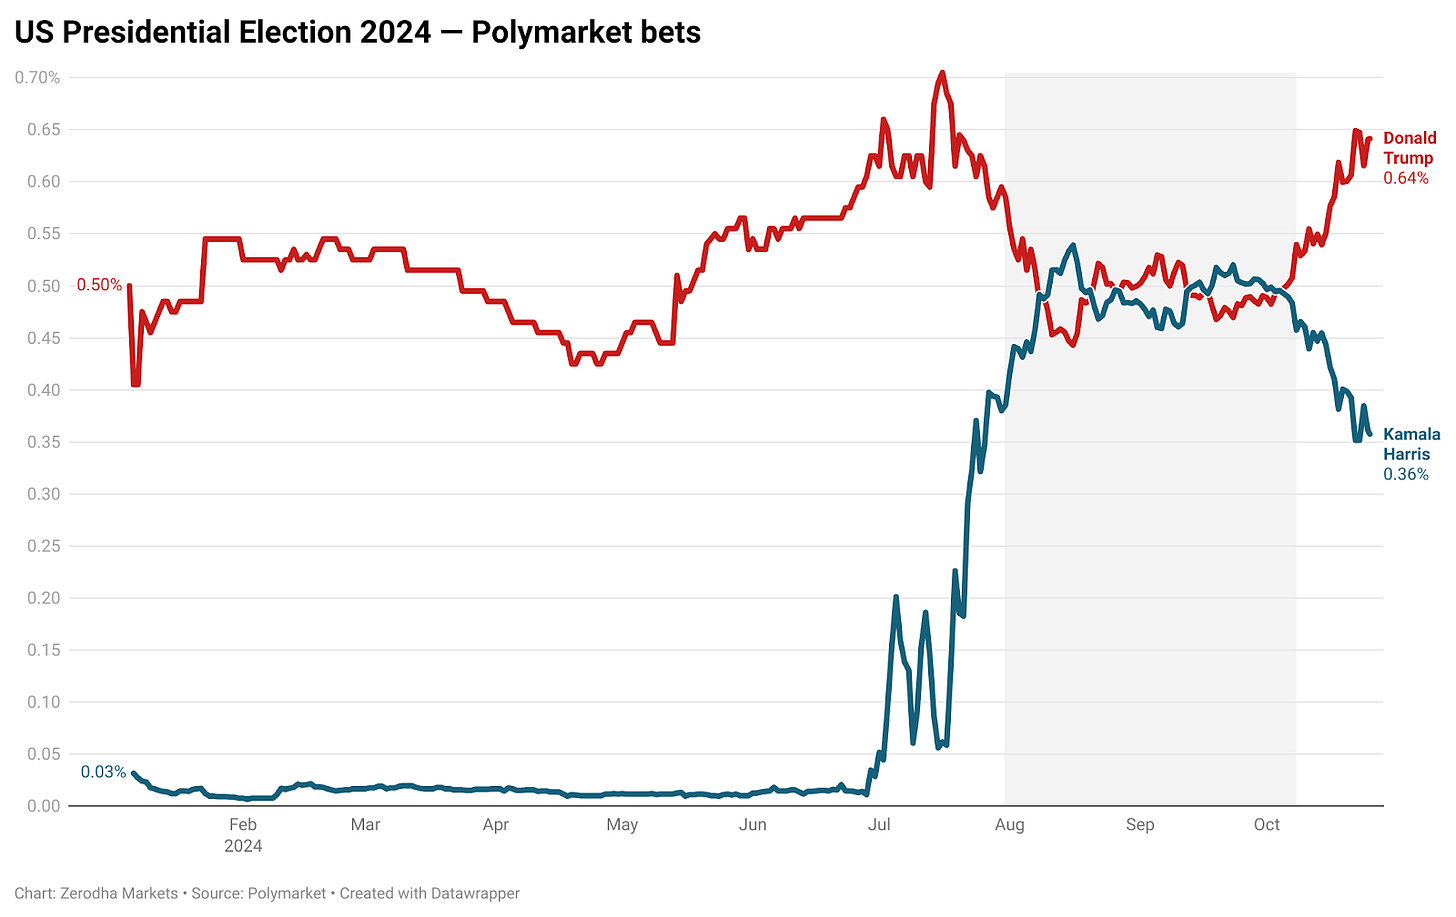
First up is Polymarket, a blockchain-based prediction market where people bet on future events like elections. Think of it as the “wisdom of the crowd.” Users buy and sell shares in different outcomes, and the prices reflect how likely people think each outcome is. All the current bets on Polymarket point to a Trump win. (In case you’re wondering, prediction markets like these aren’t legal in India.)
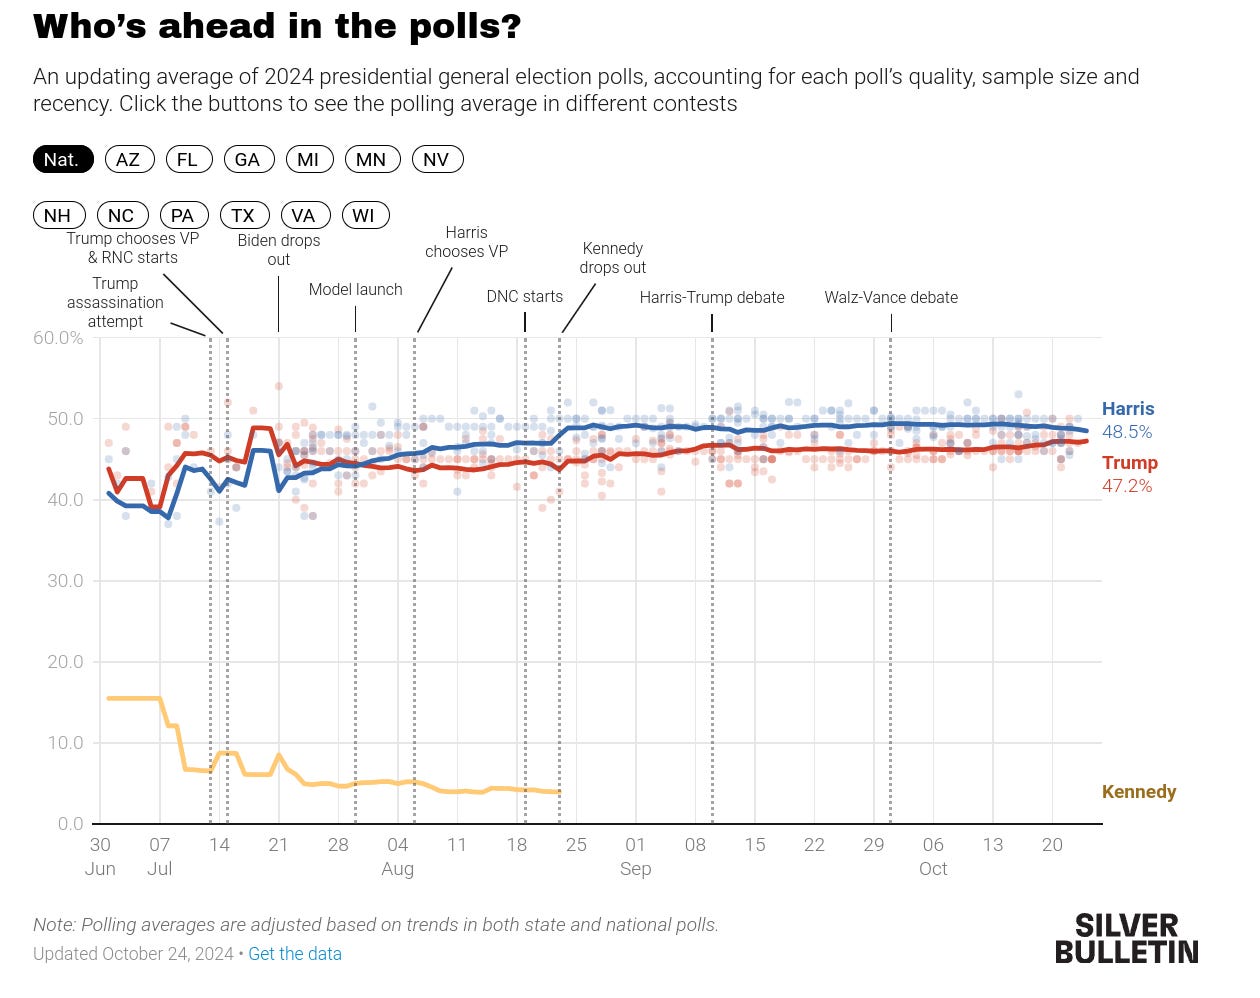
Next, we have Nate Silver, one of the most well-known election pollsters. To put it simply, his model aggregates a bunch of different polls in a sophisticated way to create an average. As of now, Silver’s model gives Harris a slight edge, but her lead has been slipping since mid-October.
Source: Silver Bulletin
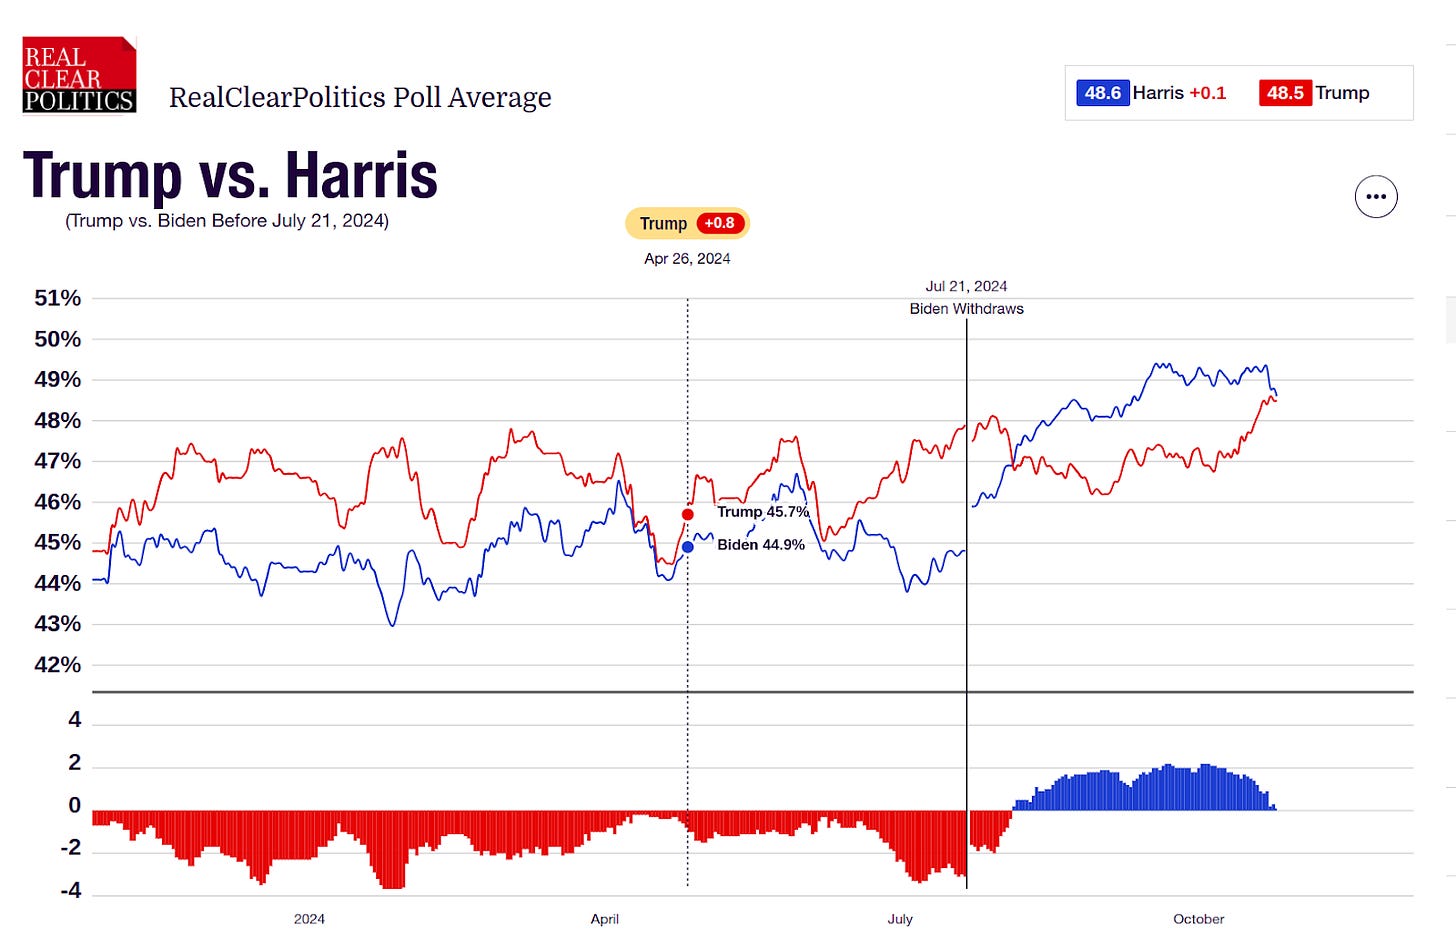
Similarly, the RealClearPolitics poll average also shows a tight race with no clear winner.
Source: Real Clear Polling
But here’s the thing about polls—they’ve been wrong before and could be wrong again. As British statistician George Box once said, “All models are wrong, but some are useful.”
Thank you for reading, do share your feedback in the comments and also spread the word by sharing with your friends.
