STT is the biggest charge on my contract note, so just curious.
Good question. Here is the data sourced from a Right To Information application.
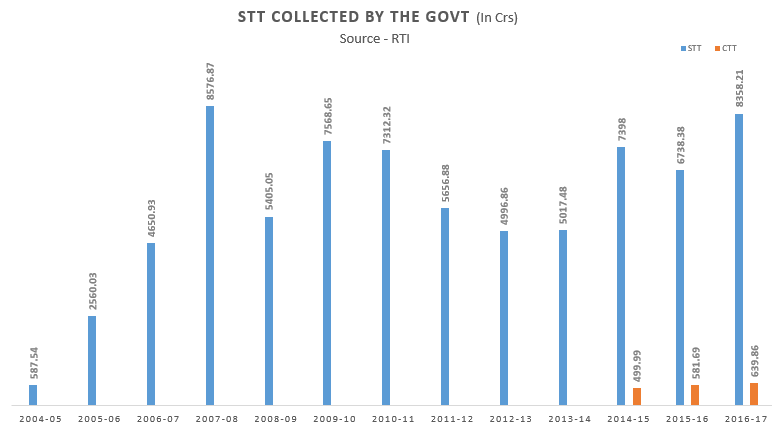
Here is the tabular data just in case.
| Year | STT (In Cr.) | CTT (In Cr.) |
|---|---|---|
| 2004-05 | 587.54 | |
| 2005-06 | 2560.03 | |
| 2006-07 | 4650.93 | |
| 2007-08 | 8576.87 | |
| 2008-09 | 5405.05 | |
| 2009-10 | 7568.65 | |
| 2010-11 | 7312.32 | |
| 2011-12 | 5656.88 | |
| 2012-13 | 4996.86 | |
| 2013-14 | 5017.48 | |
| 2014-15 | 7398 | 499.99 |
| 2015-16 | 6738.38 | 581.69 |
| 2016-17 | 8358.21 | 639.86 |
3 Likes
Wonderful info govt makes loads on money in STT & CTT
Funny - seems like people lower exposure to investing/stock markets when they actually should be increasing!
2 Likes
so when we see that STT collected by govt. is reasonably less than the previous year it’s time to enter and accumulate good stocks ? but does it holds when STT is abruptly high ?
The irony is you won’t be able to know these figures until the golden time is gone!
I guess, your hypothesis of decreasing exposure when it STT increase can be good too 
I think it holds too as a matter of fact look at those high STT collection in the year 2007-08.
2 Likes
@harshendrasingh. In 2007-2008 STT is high and later we saw 2008 crisis. So again we are at similar situation now. Seems it is time to keep cash in hand. And do more shorts than longs.
Of course you are expert in shorts 
A small debt crisis may occur in 2018, so be prepared.
No personal comments. If you don’t like what he says ignore him no need to abuse personally.
2018 is General Elections Year. Corporate private investment will be on hold. Investors go for wait and watch mode before elections.
For trading what is you need to know is direction. If you know direction then no need to fear. Trade accordingly.
Haribabu, let him say whatever, moderators will take care of him.
Hello HotHead(coolbird not appropriate for your name), here is a link to study for you to cool down your brain(if you have):- http://www.telegraph.co.uk/business/2017/08/05/fresh-fears-chinas-debt-bubble-could-burst/. Anyway I came to know who you are. And I think you just realized that my prediction may occur sooner or later that’s why you are showing that kind of hysterical behavior, but I am a Warner not expert TV analyst who are always bullish.
1 Like
Even sanctions on North Korea will adversely affect China. This will trigger crisis. We need to be careful. Aggressive positions on FnO should avoided. VIX indicates this. If VIX is above 12 you need to maintain caution.
1 Like
Trading ring is a casino where goverment &exchanges & brokers have definite edge(100% income whichever way market goes). Traders loose more when thy trade more
4 Likes
missed my chance to rebuke coolbird, post removed already 
It’s OK SBpat, but I can’t understand why some people behave hysterically when somebody genuinely try to point out a possible calamity. I never ever desire to see the market to fall but what is wrong in being little bit careful. Market can go either way and we should all be very very careful about this.
1 Like
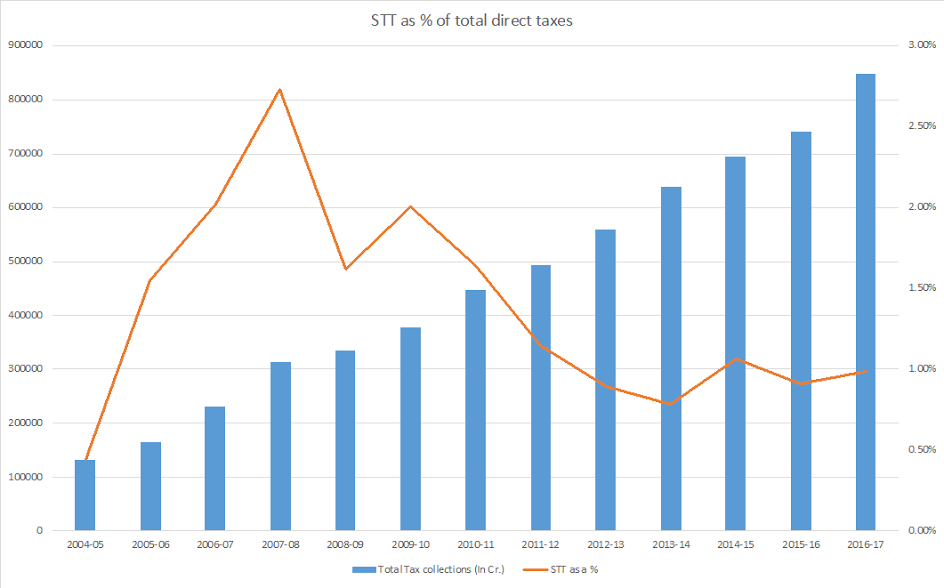
hmm… I’d not agree. Just because trading volumes and hence STT in the market has picked up and gone to 2007 pre-crisis levels is not a good predictor of a fall. Our economy has grown in the interim. Here is an interesting data point.
Total tax collection in India vs STT collection and STT as % of total tax collection
| Year | Total Tax collections (In Cr.) | STT as a % | STT (In Cr.) |
|---|---|---|---|
| 2004-05 | 132771 | 0.44% | 587.54 |
| 2005-06 | 165216 | 1.55% | 2560.03 |
| 2006-07 | 230181 | 2.02% | 4650.93 |
| 2007-08 | 314330 | 2.73% | 8576.87 |
| 2008-09 | 333818 | 1.62% | 5405.05 |
| 2009-10 | 378063 | 2.00% | 7568.65 |
| 2010-11 | 445995 | 1.64% | 7312.32 |
| 2011-12 | 493987 | 1.15% | 5656.88 |
| 2012-13 | 558989 | 0.89% | 4996.86 |
| 2013-14 | 638596 | 0.79% | 5017.48 |
| 2014-15 | 695792 | 1.06% | 7398 |
| 2015-16 | 741945 | 0.91% | 6738.38 |
| 2016-17 | 849818 | 0.98% | 8358.21 |
As you can see STT as % of total tax collection is just 0.98% in 2016/17 (below the average for last 13 years) vs 2.73% in 2007/08. This % number maybe a better gauge to see when market activity is maybe overheated.
13 Likes