hmm… I’d not agree. Just because trading volumes and hence STT in the market has picked up and gone to 2007 pre-crisis levels is not a good predictor of a fall. Our economy has grown in the interim. Here is an interesting data point.
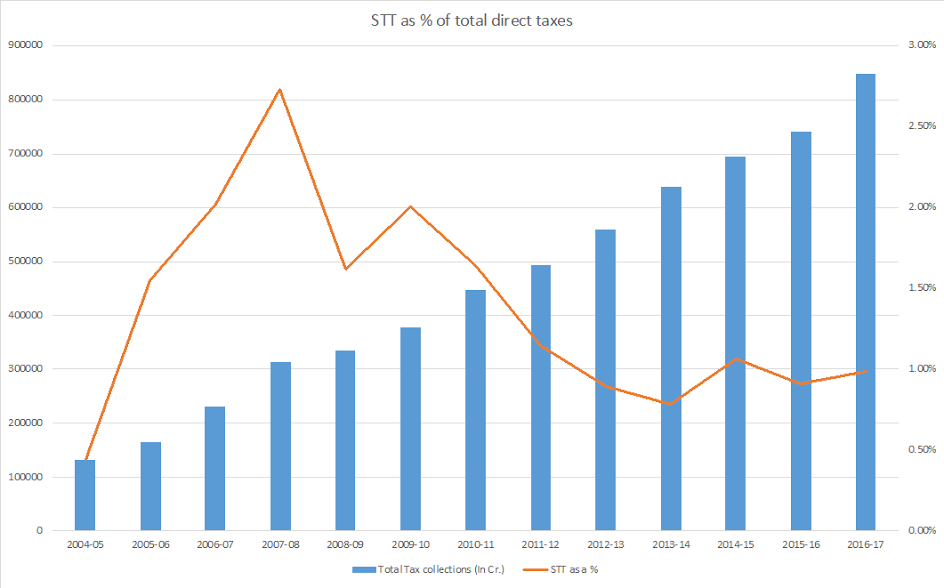
Total tax collection in India vs STT collection and STT as % of total tax collection
| Year | Total Tax collections (In Cr.) | STT as a % | STT (In Cr.) |
|---|---|---|---|
| 2004-05 | 132771 | 0.44% | 587.54 |
| 2005-06 | 165216 | 1.55% | 2560.03 |
| 2006-07 | 230181 | 2.02% | 4650.93 |
| 2007-08 | 314330 | 2.73% | 8576.87 |
| 2008-09 | 333818 | 1.62% | 5405.05 |
| 2009-10 | 378063 | 2.00% | 7568.65 |
| 2010-11 | 445995 | 1.64% | 7312.32 |
| 2011-12 | 493987 | 1.15% | 5656.88 |
| 2012-13 | 558989 | 0.89% | 4996.86 |
| 2013-14 | 638596 | 0.79% | 5017.48 |
| 2014-15 | 695792 | 1.06% | 7398 |
| 2015-16 | 741945 | 0.91% | 6738.38 |
| 2016-17 | 849818 | 0.98% | 8358.21 |
As you can see STT as % of total tax collection is just 0.98% in 2016/17 (below the average for last 13 years) vs 2.73% in 2007/08. This % number maybe a better gauge to see when market activity is maybe overheated.