Ask us any question about using Tickertape

Hello! We are Tickertape, your one-stop platform for all the stock analysis you need to make smart investment decisions.

So, what are the various stock analysis tools you can use on Tickertape?

  1. Screener

  2. Stock Page

  3. Market Mood Index (MMI)

  4. Learn

And what can you do with these tools?
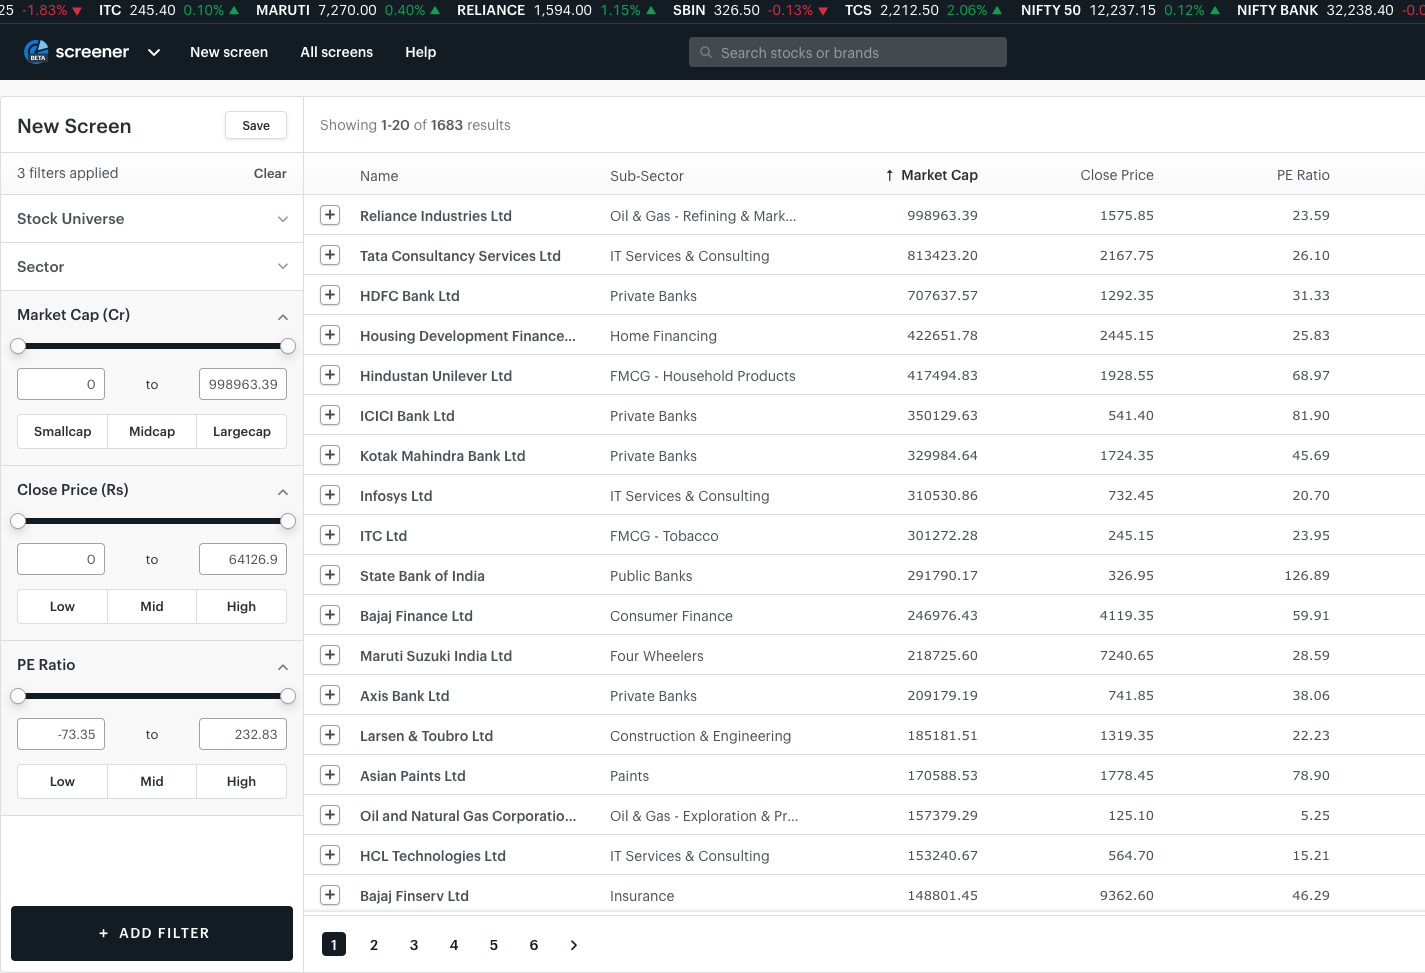
Screener

Our intuitive Screener is easy, simple to use, and customisable. Apart from using readymade screens: Basic, Premium, and F&O that filter stocks based on various parameters such as sector, income, financial ratio, market cap, quick cash conversions cycle, 52 lows, and close price, you can also create your own screens using over 130 filters, each of which has a range you can tinker.
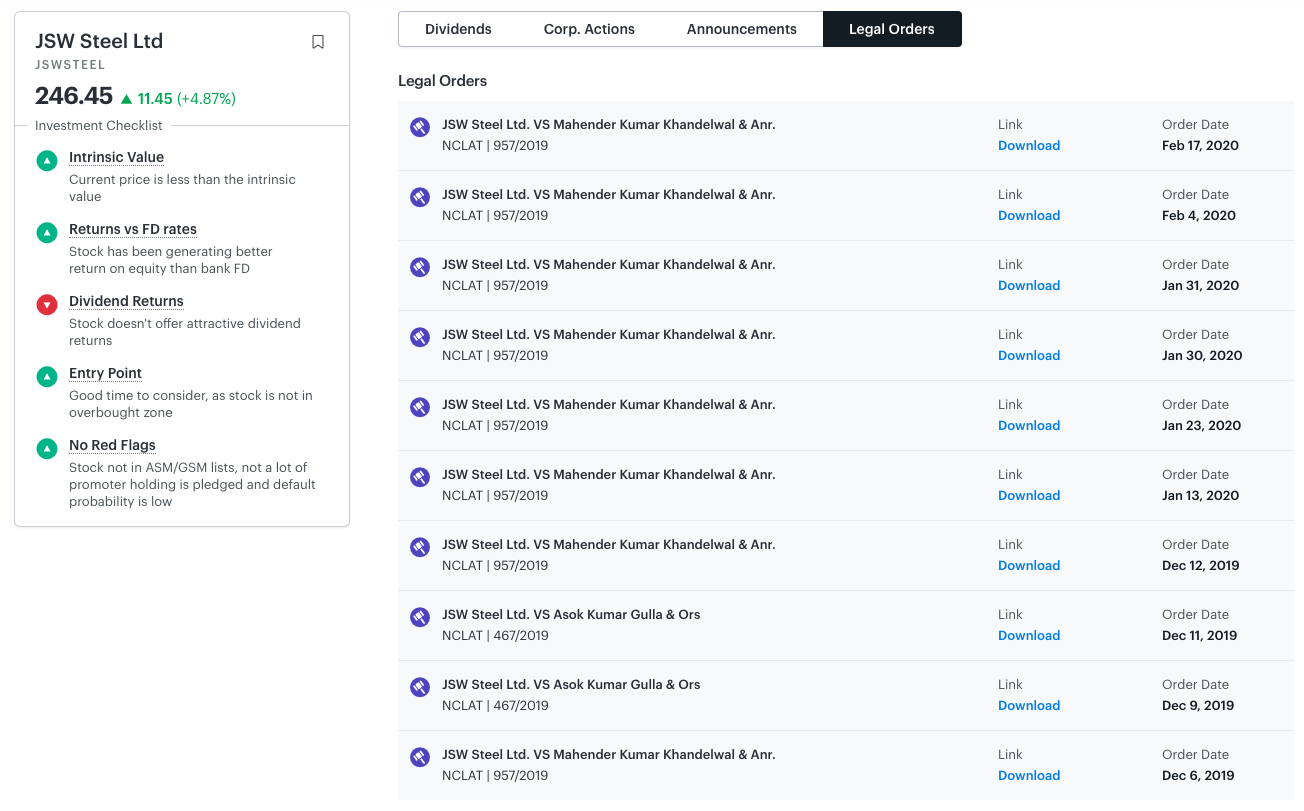
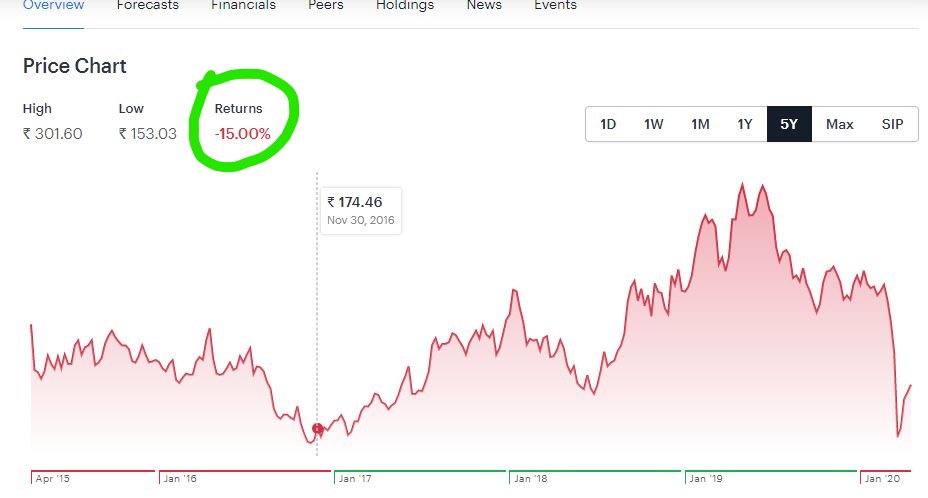
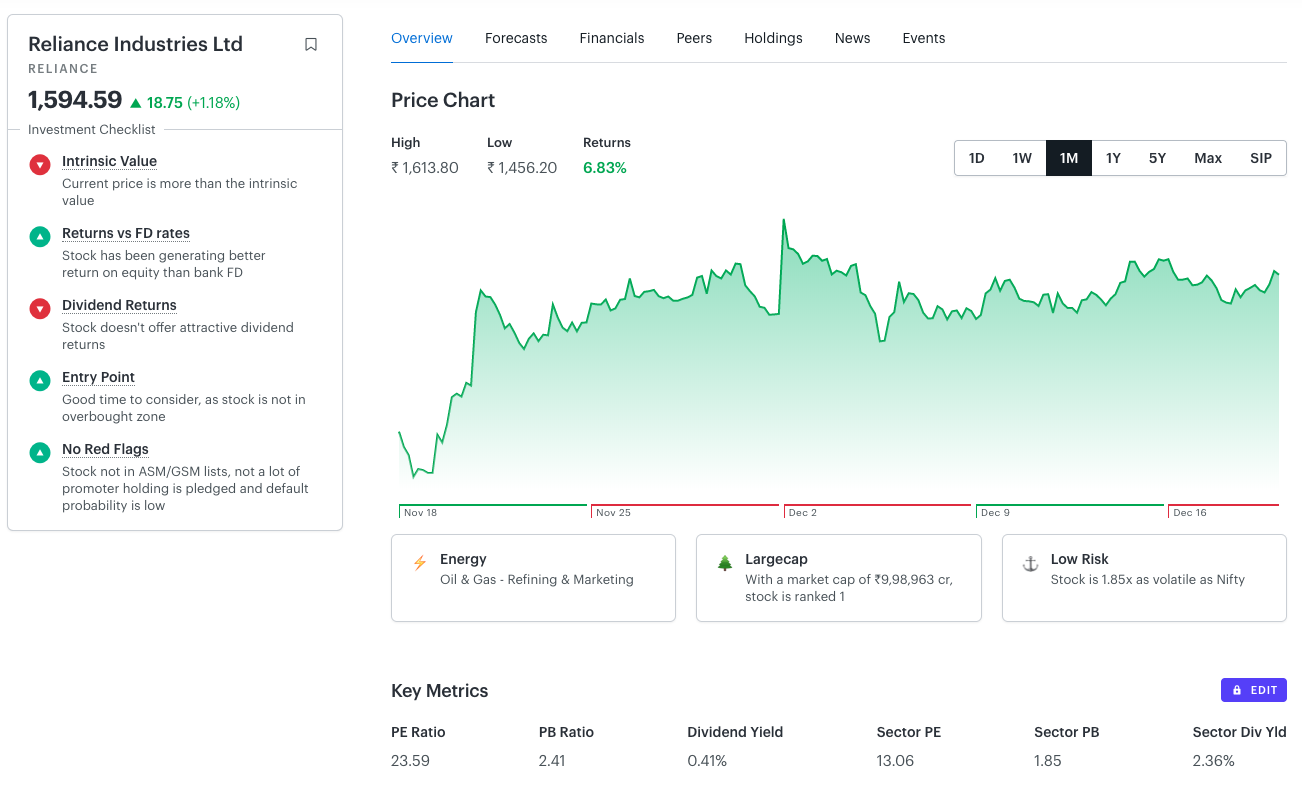
Stock Pages

Once you customise your screener to sort stocks based on specific parameters, you can delve deeper and assess individual stocks in the Stock Page by simply clicking on your chosen stock. With our Stock Page, you can access exhaustive information about a stock and evaluate its performance based on analyst’s buy rating, key drivers, and other areas that matter to you. Here, you can access the price chart, company profile, forecast and ratings, peers, and financial trends, and news of a stock.

Market Mood Index

Market Mood Index indicates the market/investor’s sentiment and has four emotional zones: extreme fear, fear, greed and extreme greed. Looking at the market sentiment and analysing historical data helps your strategise your enter and exit times.
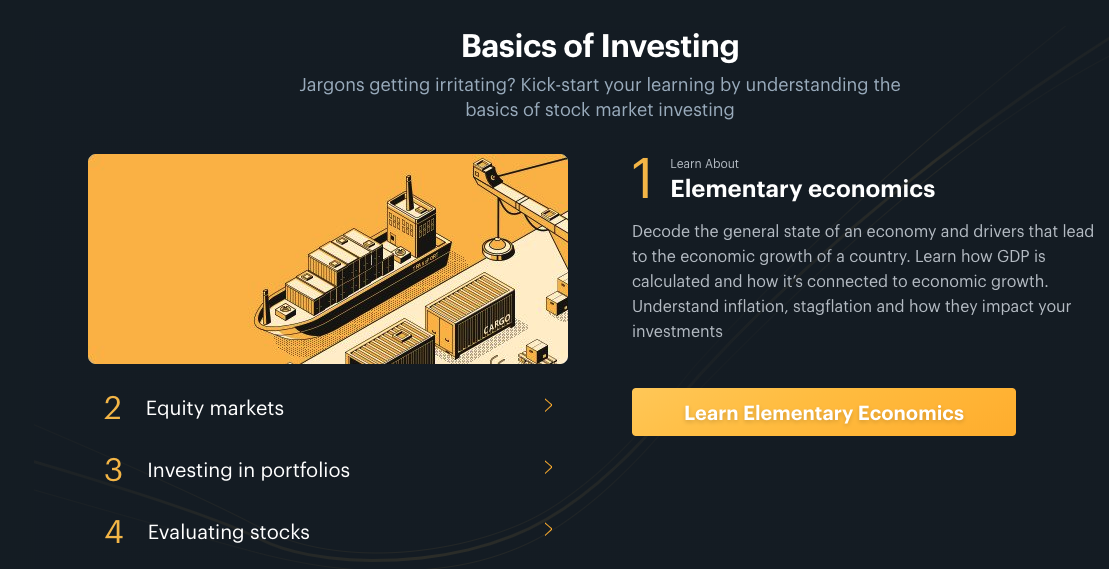
Learn

Finally, in the Learn section, learn or brush up your knowledge of stock investing.

The Learn page is a treasure trove of rich information that gives insights into various modules covering topics such as Elementary Economics, Equity Markets, Investing in portfolios and evaluating stocks.

7 Likes

Great service. I was wondering how often are pages within the Stock page updated. Data points like Recos, Stock forecasts, Financial information, etc?

Hi Saurav,

Recommendations and stock forecasts are updated as and when analysts update it. Financial information is updated annually.

1 Like

Hi,

Why is there no ROCE ratio in your screener ?

Hi Japree,

We are working on adding ROCE soon.

For now you can use our custom filter option to create a formula for ROCE. Attaching the formula for your perusal.

3 Likes

Where can I find the following parameters if available

  1. Last three years CAGR sales growth rate is more than say 10%
  2. Last three years CAGR profit growth rate is more than say 12%
  3. 3 year return of stock price

Thanks

1 Like

Where is JSW on the acquisition of Bhushan Power?

What orders did NCLT/NCLAT/CESTAT give?

Be on top of the latest news about disputes and court orders on Tickertape

Browse through the “Legal Orders” section for all the latest updates

I’ve recently subscribed to Tickertape and I find it useful to some extent as I’m more into fundamentals.

I think it’ll become much more useful if we can either create and/or import our portfolio from Kite, etc.

1 Like

Hi Tickertape

Since companies announce results quarterly, can’t fundamental metrics like Book Value, EPS etc be updated quarterly.

@Tickertape

is there any option/reports to get the actual returns of one’s investment on stocks after considering the bonus issues, or others, etc

Thanks

Wipro - 5 Year Chart

Hey Nishant,

Thanks for your feedback. This feature is coming out soon :slight_smile:

Hey, We are working on getting quarterly results on TT . This should be available soon. :slightly_smiling_face:

1 Like

Hey Muniz,

We’re afraid not. We show returns completely on the basis of the stock price.

Hope this answers your question.

Thanks @Tickertape.

1 Like

I think access to information is so much that having actionable ideas is more important than information.

1 Like

@Tickertape

#1. Currently in the industry, fundamental analysis softwares like Capitaline Plus & Ace Equity enjoy a complete dominance amongst many sophisticated fundamental individual investors and fund managers alike. Do you have any plans to introduce such desktop softwares at much lesser prices and better UI than them? They are charging some Rs 1.7 lakhs / year. But although it’s worth it but too much for funds anything below 1 crore AUM.

#2. On your web platform, you should look at introducing historical valuation charts, such a P/E, P/B, P/OCF, P/FCF charts. AND THAT HAS TO BE CONSIDERED.

#3. Let users add their own ratios on TT such as Debt/Equity.

#4. Extend the time of the data, instead of just 5-6 years, provide 10 years.

#5. Do take inspiration from these 2 websites: ticker.finology.in and www.tijorifinance.in

2 Likes

Hey, Thanks for your suggestions

To answer your questions

  1. We don’t have any plans to introduce desktop softwares for now. But we have taken your suggestion and passed it on the the product team.

  2. We are currently working on these and they should be available soon.

  3. You can use custom filter option to add your own own ratios.

  4. We are working on extending the time period of the data available.

  5. We are constantly adding new features to tickertape and working on improving the experience we provide to the users.

Hope we have answered all your questions. :slightly_smiling_face:

1 Like

I’m fascinated by finviz.com. is your platform same as finviz.com?

How to add a custom filter for
% Price above 200D EMA/SMA?
@tic

Now Buying and selling stocks is easier than ever before with Transactions! :money_mouth_face:

Forever change the way you trade stocks by being able to analyse, transact and manage your entire portfolio on Tickertape

Learn more: https://bit.ly/34d0bAU

Update your android app to start using it: https://bit.ly/37cggGA

Watch this video to help you get started with our “Basket” feature: https://bit.ly/2FxrtYd

And here’s a quick tutorial on how to sync the “Portfolio” feature: https://bit.ly/318SaL8

1 Like