Thank you for your information but here we are trying to optimize the above mentioned strategies only.
Ohh my bad, will delete it.
1 Like
@tradeneeti. Increasing the Aroon period to 40 is really good to avoid whipsaws or too many trades. However, having a target of 4% with SL of 2% is very tight especially for trading on day candle. Aroon also identifies the momentum in the stock and it could be used to be invested to ride on-trend.
I have run the backtest with below settings and there is a drastic improvement in the return.
Aroon 40 period
Buy: AroonUp crosses above Aroon down
Sell: Aroon Down > AroonUp and Aroon Down > 50. ( I will not exit unless there is a downtrend)
No Stop loss and target.
Here is the equity graph for the backtest from 1 Jan 2016 to 28 Apr 2020.
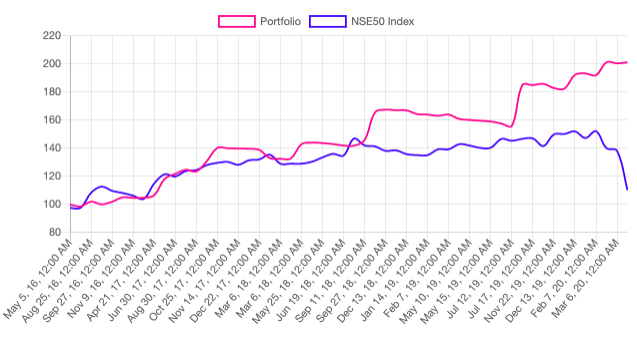
A return of 100% over 5 years against an index return of almost nill during the same period, with a portfolio drawdown of ~15%.
Here is the individual stock level performance.
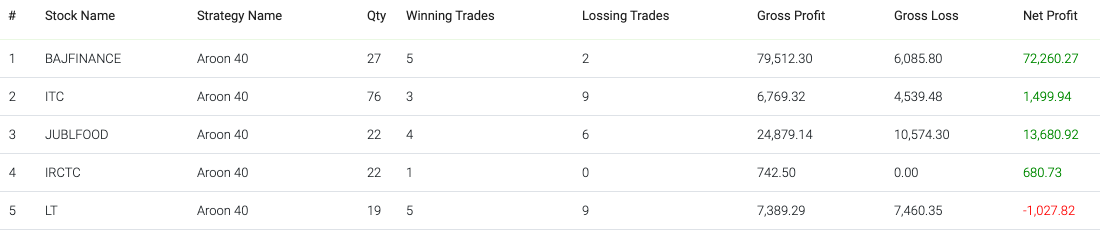
This is on investment of 100000 equally allocated to all the 6 stocks. Approx 16000 to each stock.
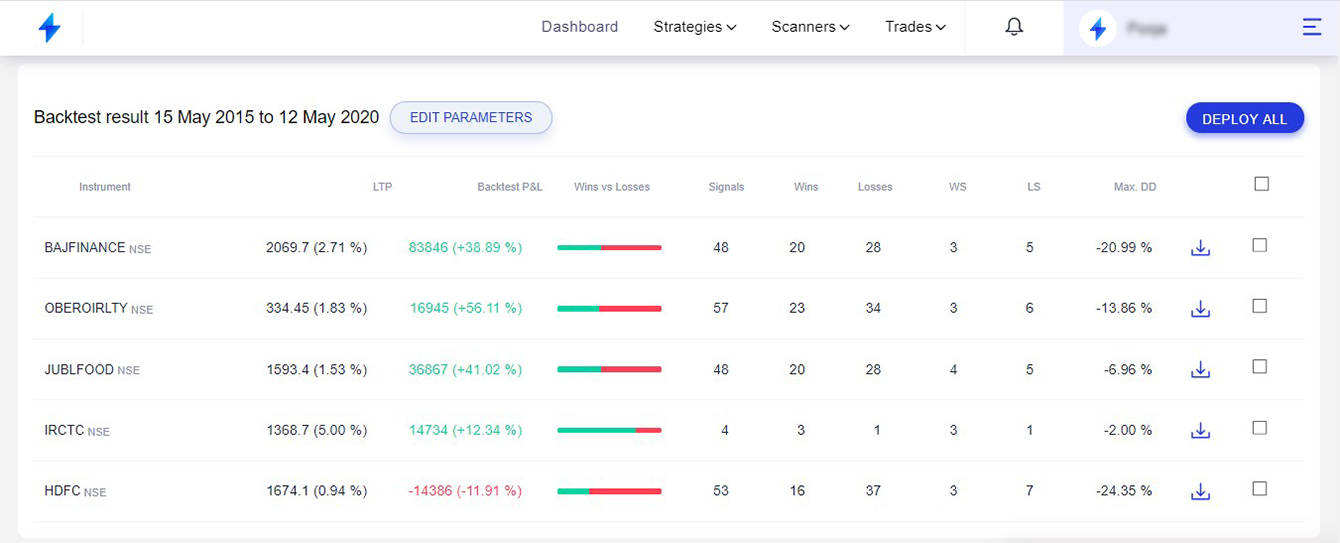
Now one of the problems with the above backtest is stocks itself. Most of the stocks we picked have been in good trend during the backtest period and we are faced with the problem of overfitting.
Aroon on Nifty50 stocks:
I ran the same strategy on all the nifty 50 stocks
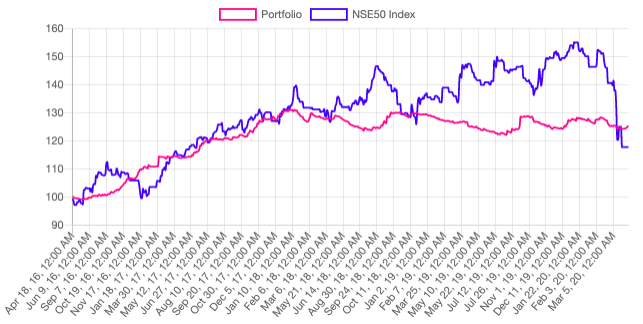
Clearly good performance in a bullish market but loses its value on the sideways market. If you happen to pick those stocks which are moving sideways and give a false trend signal, the strategy might not work.
2 Likes
Frankly, No stop loss/ Target = no trade. It simply shows lack of risk management. Secondly, there is no one size fits all in stock market.
The next strategy that we will be discussing is the Stochastic Indicator. We will also take a look on how it has performed in the past.
Just not having a stop loss or target doesn’t mean that your strategy don’t have risk management. The positions are not naked, as Aroon would trigger an exit if it’s not favorable trade. The whole idea of my strategy to ride on the trend. Largest loosing trade was Rs.5614 against largest profitable trade of 28,814. Profit factor of 4.42 against winning trade of 43%. Also portfolio level drawdown of ~15%, indicating in a worst case scenario, one could have lost max of 15% for a return of 99.16%.
It means that the strategy has risk which is unquantified before hand.
Means, for some stocks before the exit criteria is met, a loss of 5% can happen and for some in volatile markets like there can be 50% too.
Not having hard/trailing SL/TP is not wise in any scenario.
1 Like
So here we are with the stochastic strategy
- Stochastic Indicator
It is one of the most popular indicators as it is easy to understand and has high accuracy.
Stochastic are used to show when a stock has moved into an overbought or oversold position.
Buy signal: When the 14-day stochastic indicator crosses above 45 on the Day chart
Stop loss: 2
Profit: 4.5
This screenshot is the backtested result for the buy-side strategy.
1 Like
The stock market has zoomed its way breaking the 17700 level. An important resistance level for the nifty bank today.
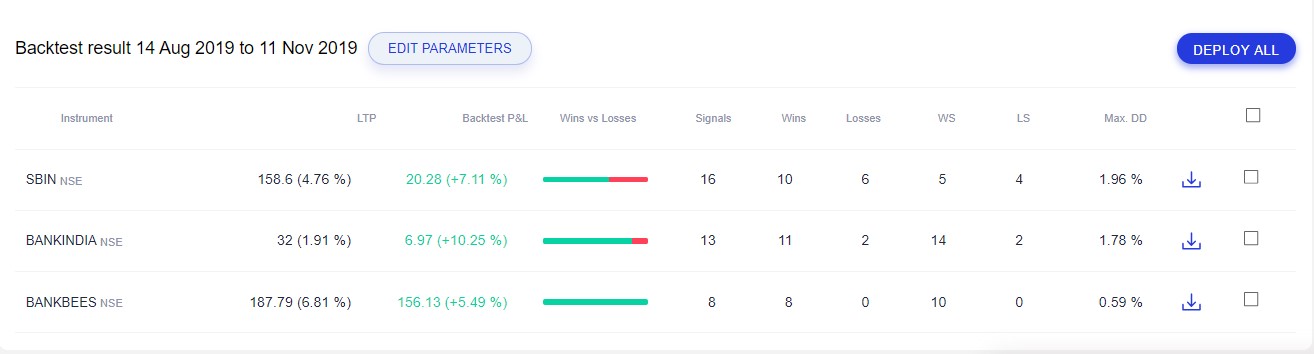
Keeping up the flow of concentration in the banking and financial sector as it witnesses increased attraction in the last few trading sessions we shall discuss a strategy has worked well for the banks and Bankbees
Buy signal: Buy 100 shares when the close crosses below the parabolic SAR on 5 mins TF with 0.8 % stop loss and 2% target profit
And volume should be higher than 20 moving average volume
Exit strategy: When close crosses below parabolic SAR
This is the screenshot of the backtest results
can you share the link for this strategy