Hello traders,
So I was researching on different trading strategies that I could use to improve my trading pattern that is when I came across this article by Economic Times that listed a few strategies to be the best and most popular in 2019.
I am going to test each of them and discuss the results here. I request you to come up with suggestion to improve the same for better results. Also I am going to use a set of common stocks for all the back-tests for better comparison so you are free to suggest some of your favorite stocks too.
Bollinger Band
This is the most common strategy used by trader community and I think it is one of the most simple one too. They have used the default parameters of 20 Day moving average and standard deviation of 2. So the upper and lower bands are combined with 20 day moving average by adding and subtracting 2 standard deviation to the moving averages.
Buy signal: When the price falls below the lower bollinger band
Sell Signal: When the price goes beyond the upper bollinger band.
I personally prefer to keep the SD at 2.5 sometimes to reduce the noise and to be more sure. But in this backtest I will be using SD of 2 only.
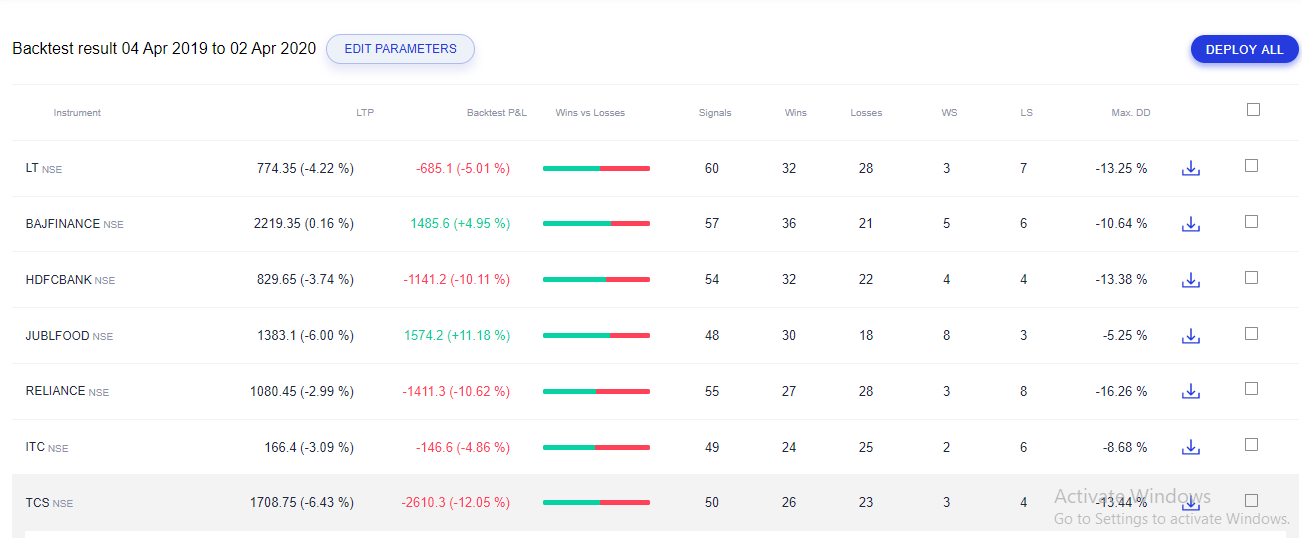
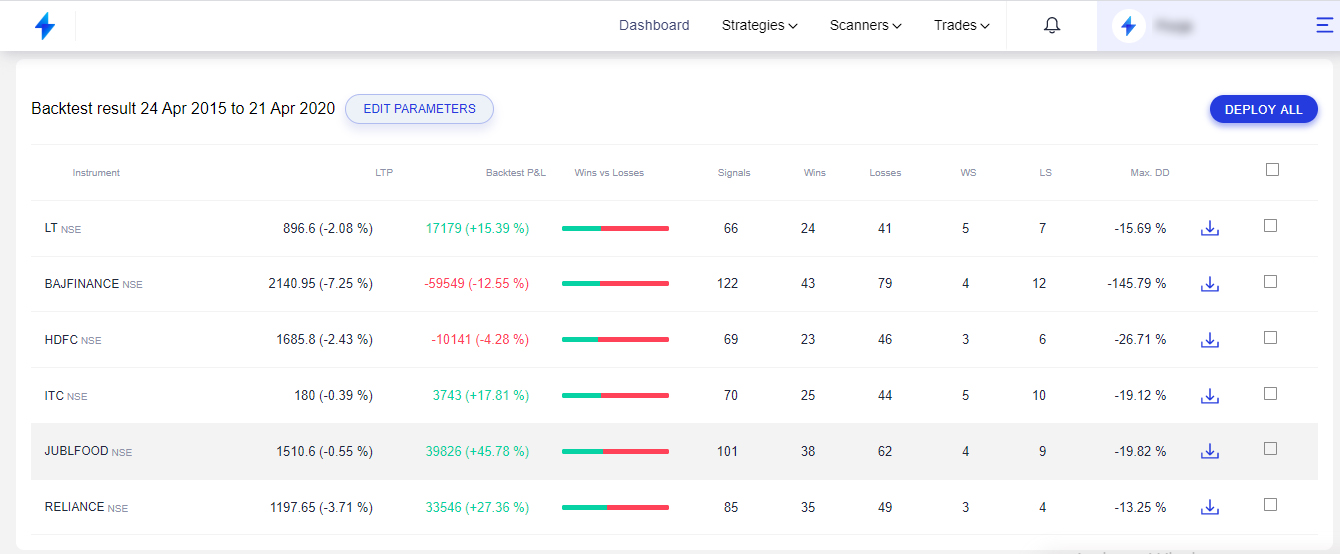
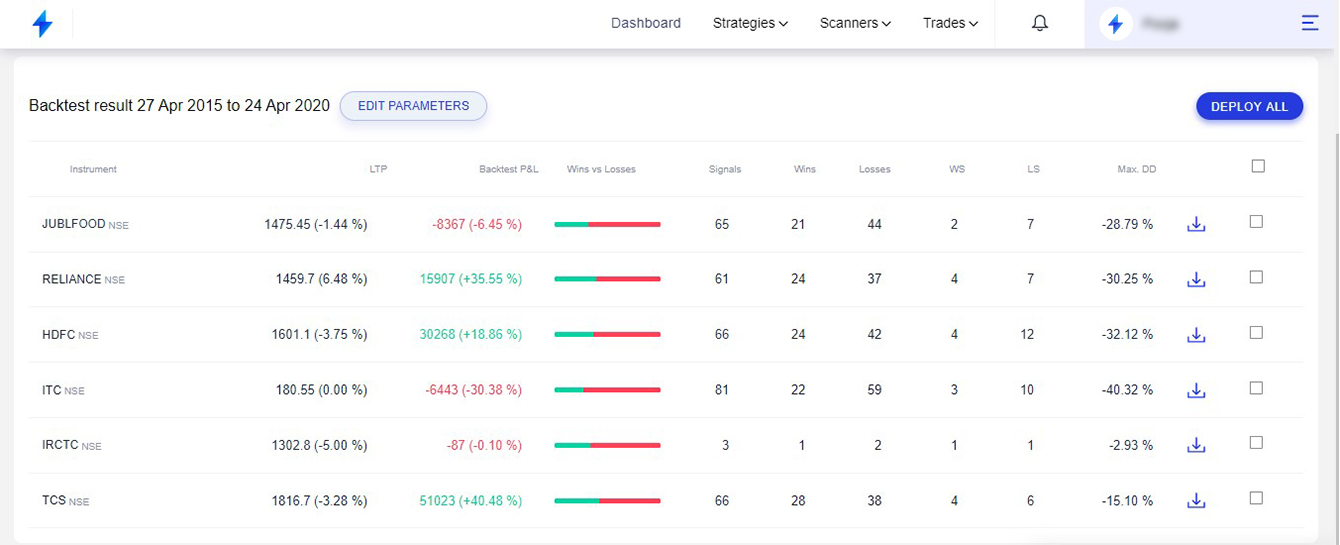
The first screenshot is the backtested result for buy side strategy
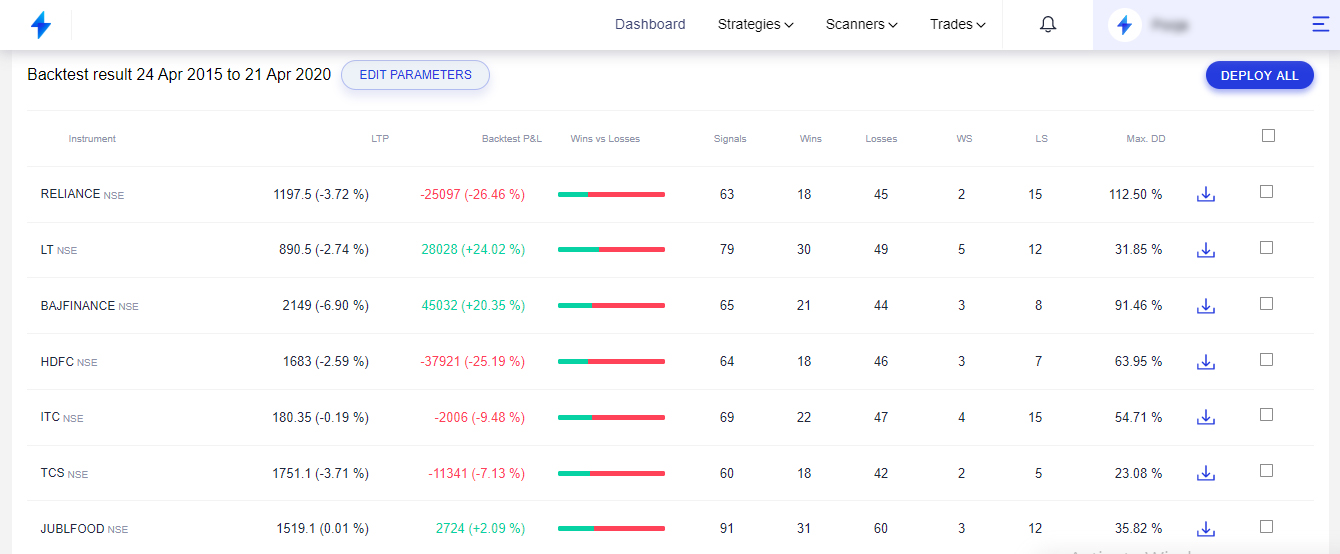
We can clearly make out from the above results that the strategy has worked tremendously well for the sell side than buy side. It is important to understand that this strategy has been backtested with stoploss of 2% and a target of 4%.
@tradeneeti Few questions on your backtest: 1. What is the candle period selected? 2. Is it Intraday or positional? 3. Also, your entry and exit rules.
The article doesn’t provide more details to it’s buy and sell conditions. It just says.
Buy when Close < LB and Sell when Close > UB without SL/TG.
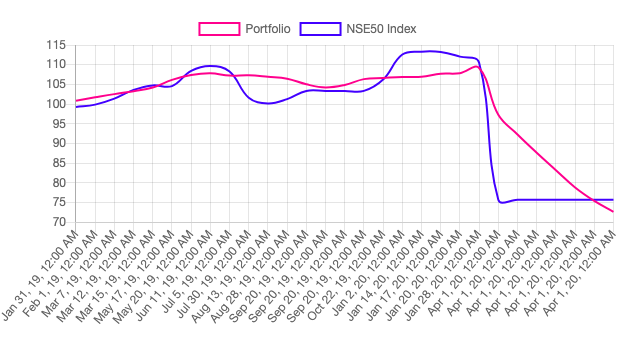
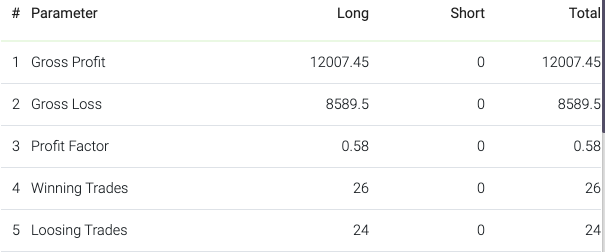
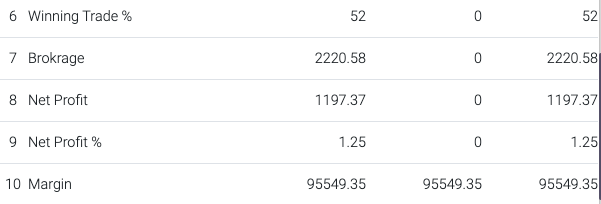
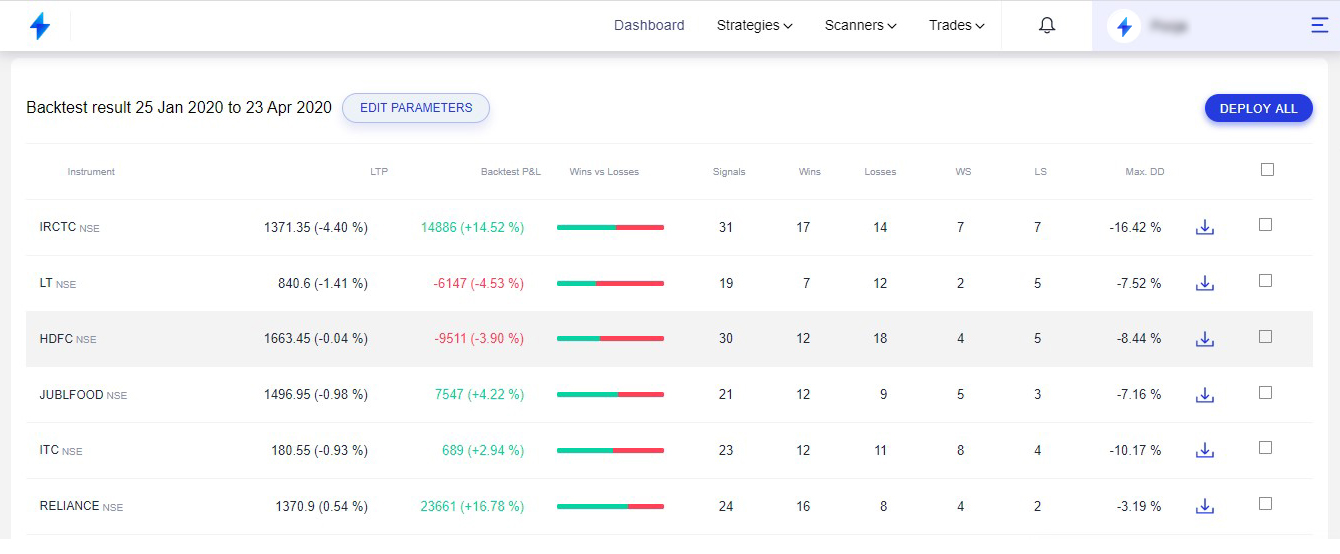
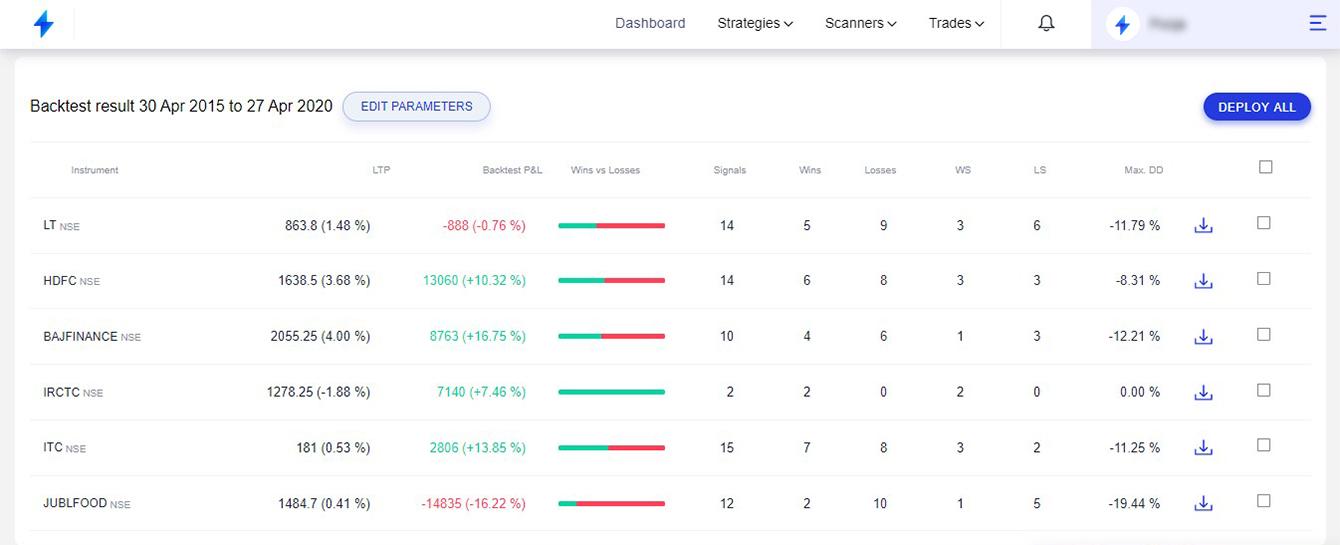
Here is the consolidated result of rules as above without SL and TG on the same stocks selected by you and on day candle with 1L as capital allocated equally.
This strategy might work on a range-bound market but not on big trends. The free fall at the end is mainly because there was no condition to exit if the trade is not in favour.
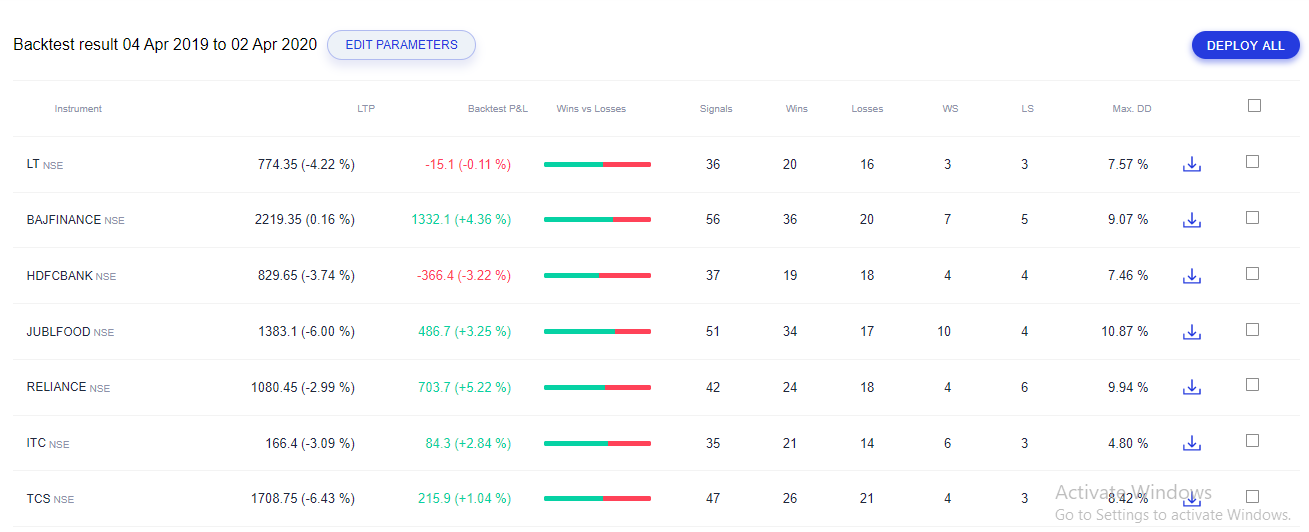
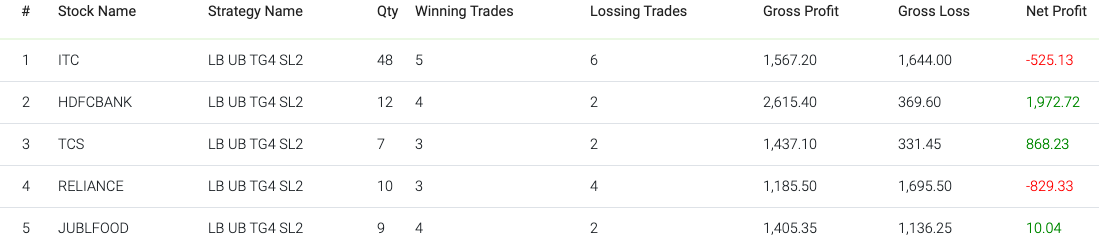
I ran the same strategy with the Long only condition (as we selected candle as “day”), by making few changes:
Entry: Close < LB
Exit: High > UB or SL: 2% or TG: 4%
If you look at the chart highlighted in two boxes. The strategy would take position hit the SL in next day and meet the condition again in the next candle.
Few Changes to strategy.
Buy: Close> UB
Sell: Close< MB
This is strategy identifies the breakout and follow the trend.
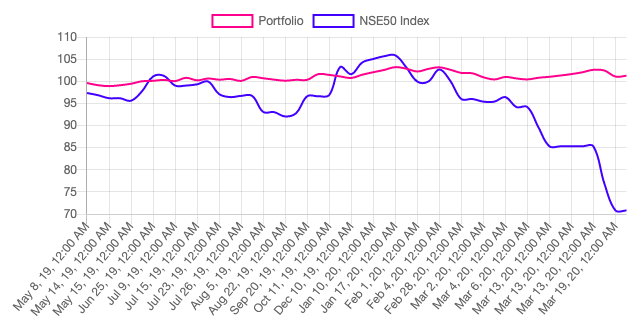
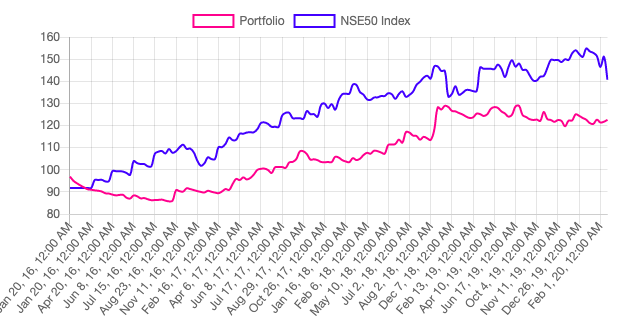
Here is the graph on the same stocks backtested from 1 Jan 16 to 3 Apr 2020.
The graph shows results until mid Feb 2020, because it closed all the positions by then. Effectively 23% return against 2.5% return of the index as on 3 Apr 20.
@Vaga The entry and exit used in the above back-tests are not modified. Here we are going to check the profitability of each strategy mentioned in the article just as is to understand and compare different strategies that are popularly used by the traders
As you said, the downfall of the stock is majorly because of the exit conditions. So by the end of this, we shall also make a note of all the suggestions that will optimize the performance of these strategies
I haven’t taken a period of 4-5 years because practically no strategy will perform consistently for such a time without any variations as according to the market and hence it is more appropriate to to change the strategies with the changes in the market.
Also with regards to the quantity/ capital. This can be increased. So in the next post I will run the same back-test with increased quantity to thoroughly understand the profits.
The time frame for the candle used is the hourly candle.
It is a positional call
As mentioned above there are no modifications to the rules , the buy and sell will purely be on the close of the price i.e Buy signal: When the price falls below the lower bollinger band
Sell Signal: When the price goes beyond the upper bollinger band.
Moving forward, we will be discussing the next strategy from the article by Economic times which is the commodity channel index ( CCI ).
The commodity channel Index ( CCI ):
It is calculated by measuring the current price levels of a commodity relative with the historical price of the same commodity for a specific period. The value of this indicator is zero. The indicator value above zero implies that the current price is above its historical average and the indicator value below zero simply means that the price is trading below its historical average.
Buy signal : Value greater than 100 indicates new strong uptrend is beginning.
Sell signal: Value less than -100 indicates strong downtrend is beginning.
Stop loss is 2% and profit is 4%
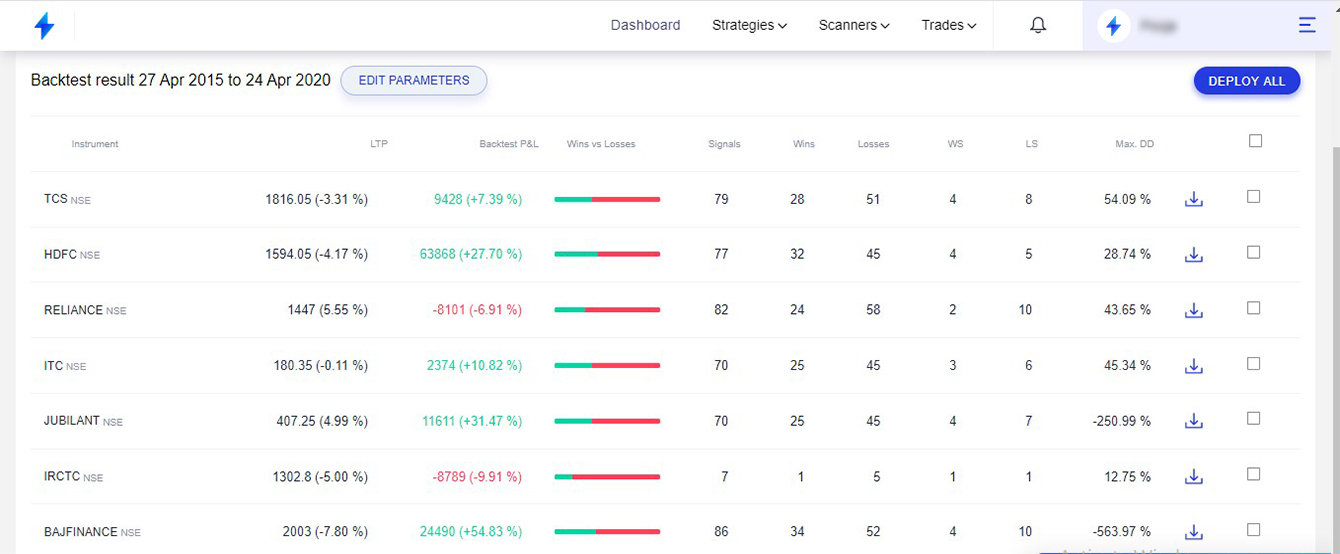
The first screenshot is the backtest result for the buy side strategy.
We can clearly make out from the above results that the strategy has worked pretty well for the buy side and ended on negative note for the sell side . It is important to understand that this strategy has been backtested with stoploss of 2% and a target of 4%. This back-test is run for 5 years historical data on the day chart as suggested above.
As we can see the buy side has given an average of 14.99% per share for a span of 5 years after recovering the losses on the buy side and a negative of 2.09% on the sell side.
can you back test pivot point strategy (standard or Fibonacci) on a 5 min tf or 1 min tf. if close is above any resistance buy and sell if close below resistance.
will be of great help.
So I have back tested results for a few stocks
It is on a 5m time frame, for the buy side only. So, when the price closes above R1, R2, R3 a buy call will be executed.
hey thanks for testing. the results are good. but i think the period should be changed as markets were very volatile and bearish since feb to march. what do you think ?
Since the tests are done on the 5m time frame you will be able to get results for a period of 3 months. To optimize the results even further, you can either increase the time frame to get results for higher period or add specific start and end date of your choice to the back-test.
Moving on to the 3rd strategy mentioned in the article, It is the William %R
William %R
It is a momentum indicator that moves between 0 and -100 and identifies the overbought and oversold zones. It helps us determine the entry and exit position. We should keep in mind certain points before taking any positions on this strategy and they are
Williams %R moves between zero and -100.
A reading above -20 is overbought.
A reading below -80 is oversold.
An overbought or oversold zone does not mean the price will reverse, it simply means that the price of the stock is near to the highs or lows respectively.
I will post below the backtest results for the same strategy and we shall further compare the results.
With the help of the back test results we are able to make clear conclusions that the strategy works tremendously well for both buy and sell side. However, it has worked slightly better on the sell side. This strategy is run for 5 years historical data on the day chart.
So here is the backtest results of the a few stocks with aroon indicator. We have used this strategy for a period of 5 years on the day chart with 2% and 4% as the stop loss and target respectively.
Buy signal : Buy when the the aroon up crosses above aroon down.
Period used : 40
The whole point of back-testing strategy is improving them for better results. I think you could come up with a suggestion for this one which would be of some help.