Buy Script : CROSSOVER(EMA(CLOSE,10),EMA(CLOSE,20))
Sell Script : crossover(EMA(CLOSE,20),EMA(CLOSE,10))
I am backing this script on Ambuja Cement with following parameters
Periodicity : Day
Bar Interval : 1
Months : 6
“No trades are generated” by Pi.
But When I look at chart of Ambuja Cement on Pi and plot 10 and 20 EMA, There are many crossover in last 6 month.
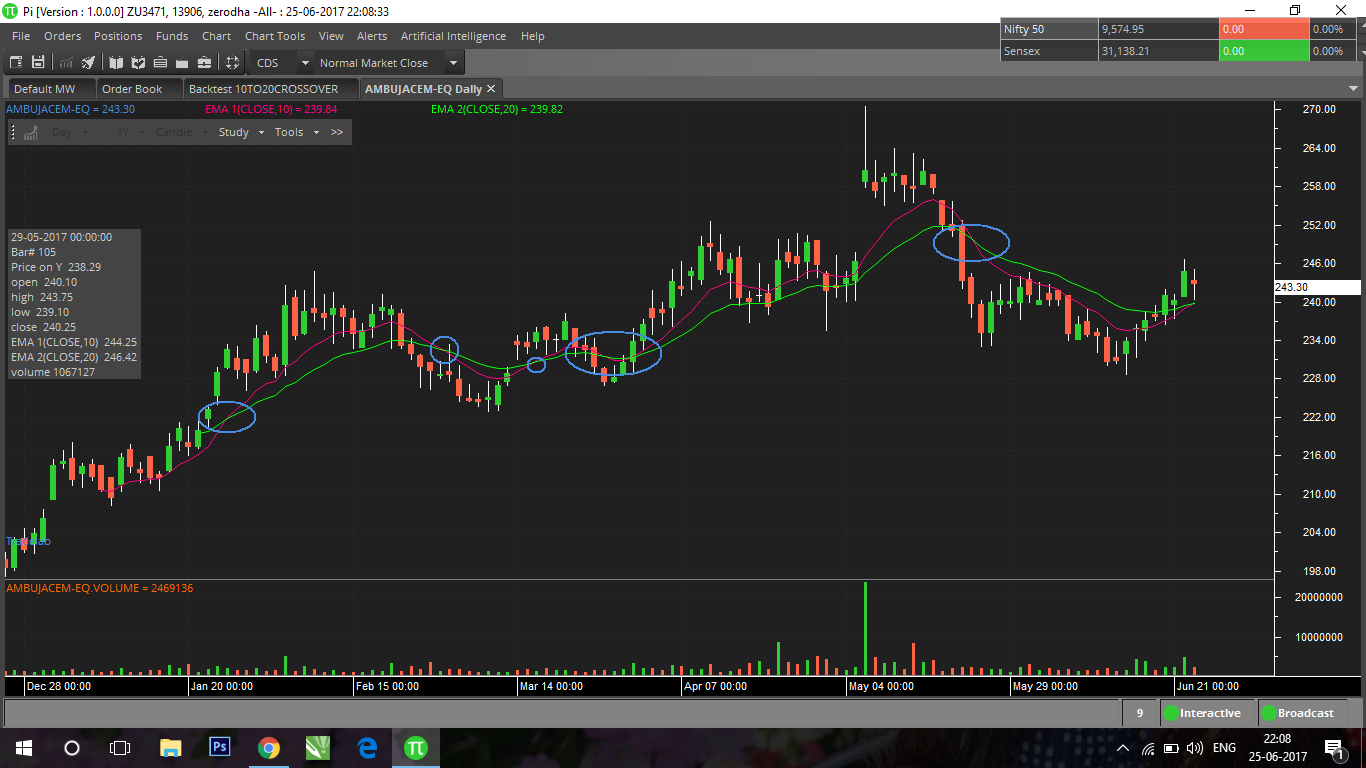
One of the most visible is on 23-05-2017 when 20 EMA crossover 10 EMA. Sell signal should be generated here.
I have completed my trade script study and have some good strategy but here I am not getting correct result so I am very confused.
Let me know if my understanding is wrong or I missing some basis of chats and technical trading.
Thank you for your support.