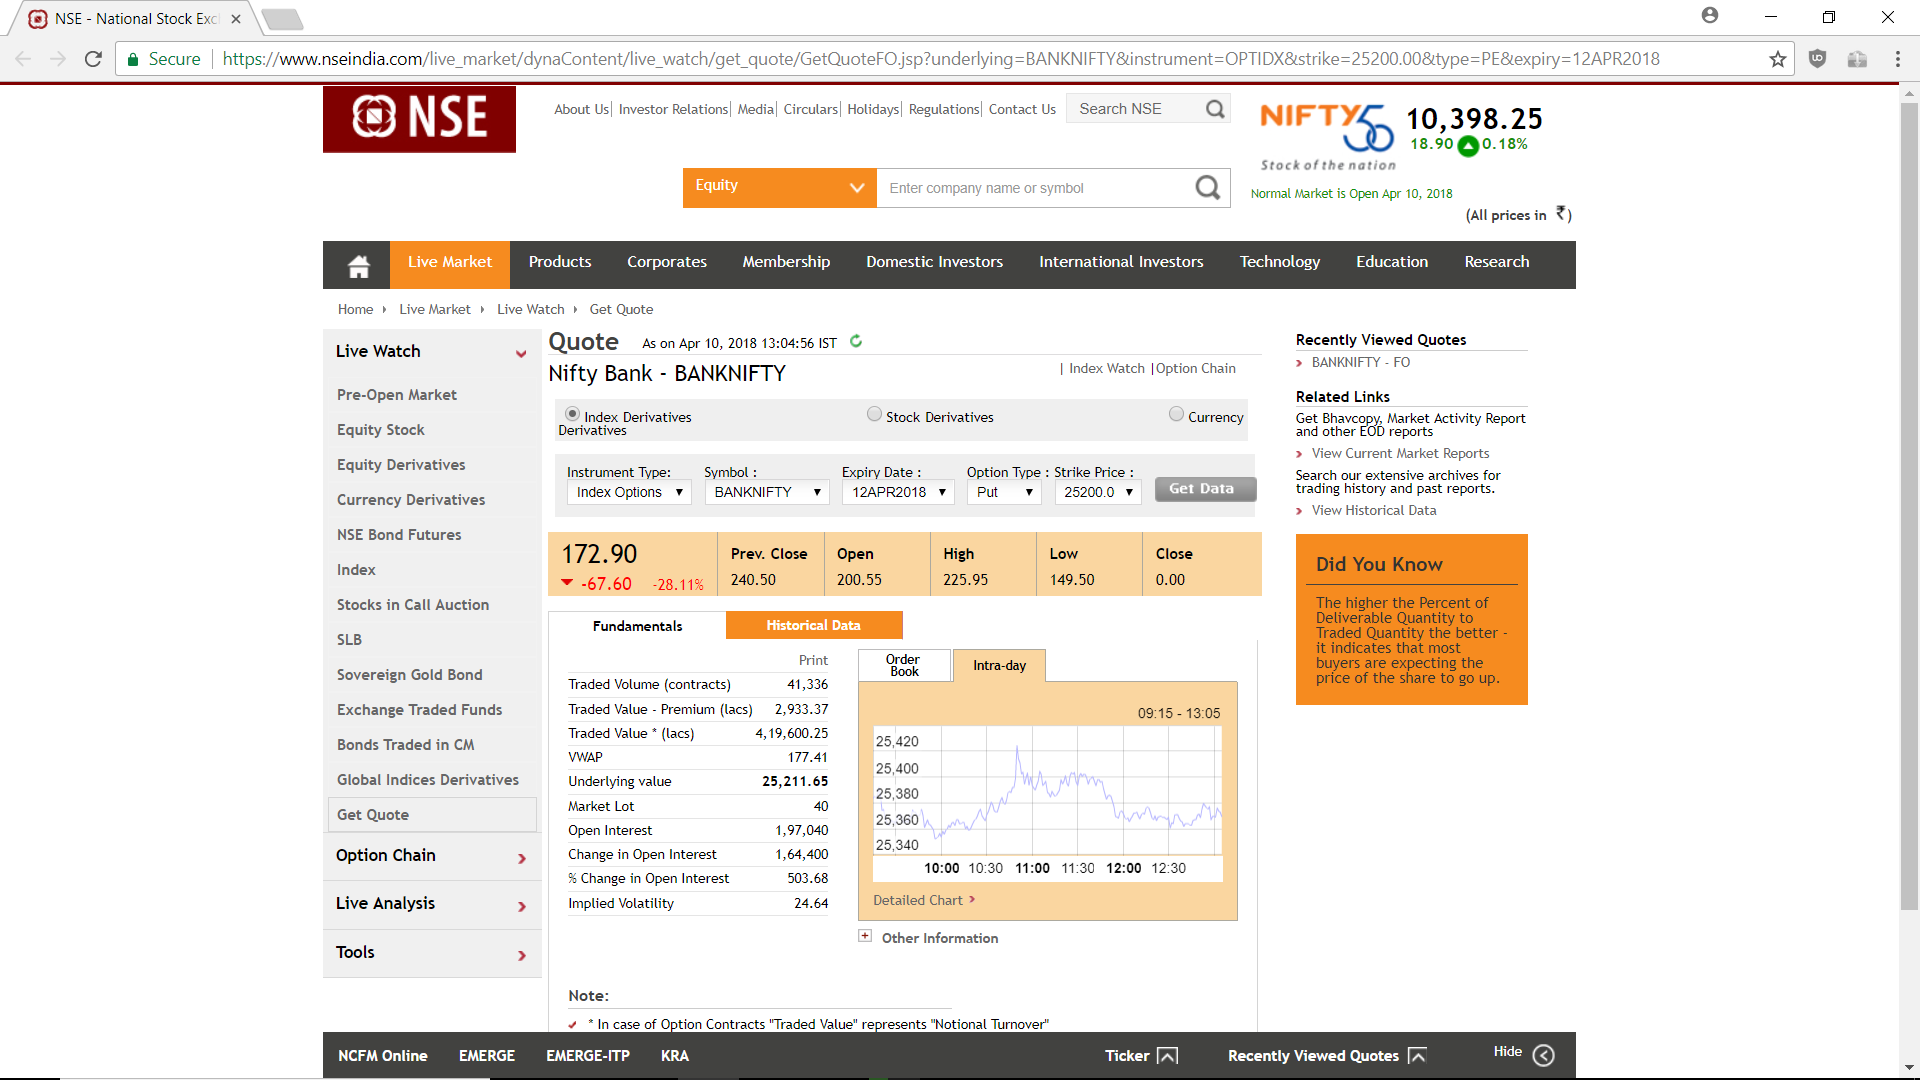
Can someone tell me what the values in the NSE graph indicate?
Its chart of BankNifty.
That is what I thought initially. But banknifty never went to 25400 today!
Graph is different for different strike price. Not sure, why this is happening.
Ha! The graph seems to show the traded option value added to the strike price! Can someone please check out? I wonder what the logic is.