
Our goal with The Daily Brief is to simplify the biggest stories in the Indian markets and help you understand what they mean. We won’t just tell you what happened, we’ll tell you why and how too. We do this show in both formats: video and audio. This piece curates the stories that we talk about.
You can listen to the podcast on Spotify, Apple Podcasts, or wherever you get your podcasts and watch the videos on YouTube. You can also watch The Daily Brief in Hindi.

In today’s edition of The Daily Brief:
- REITs, beyond the headline numbers
- The stress test for India’s inflation targeting mechanism
REITs, beyond the headline numbers
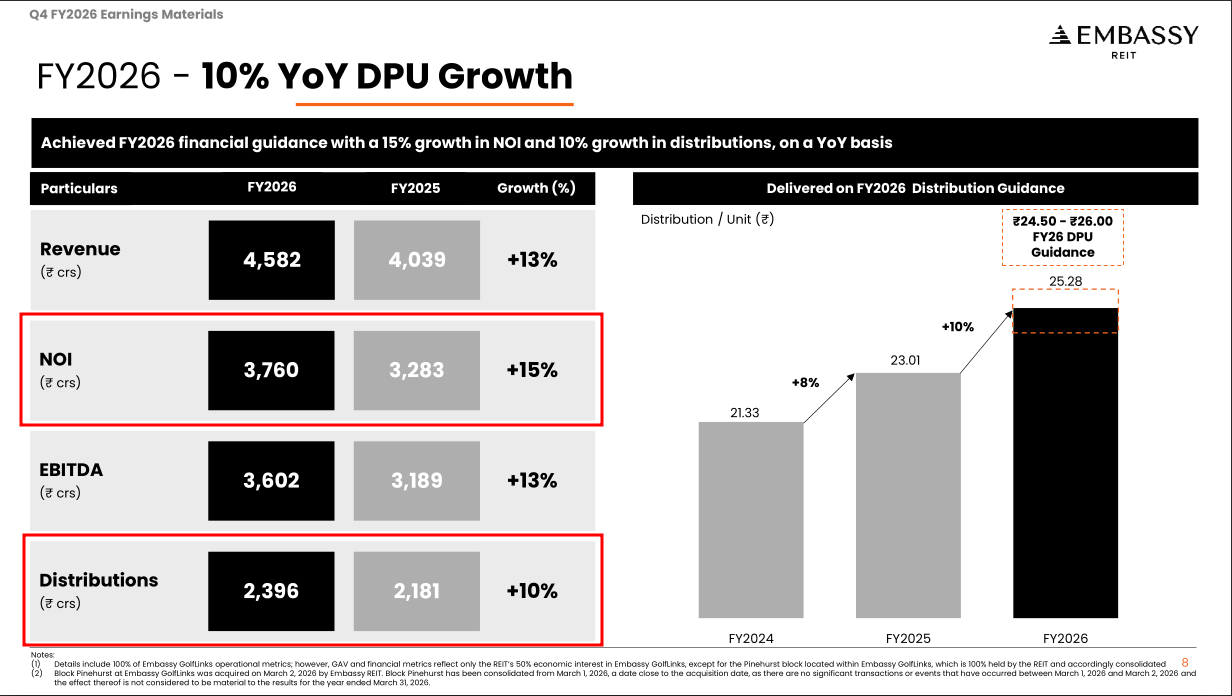
Embassy REIT’s buildings earned about 15% more rent this past year than the year before. Those who own Embassy, however, got about 10% more money. Somewhere on the way from the building to the bank account, roughly a third of the growth went missing.
This is fundamental to how a REIT works. Once you can understand why, you can read almost any REIT’s results.
We’ve written, before, about what a REIT actually is. In essence, they’re a way to own a slice of a large pile of rent-earning real estate, listed on an exchange like a stock. This piece is about something narrower: how does one actually read their results, and what that tells us.
We regularly cover company results on The Daily Brief , and rarely do we have the space to go beyond a few scattered observations. But even by those standards, doing justice to three REITs’ quarterly numbers is complicated. There are waterfalls of cash, dozens of leasing metrics, and weird valuation models. An analyst could spend a week on any one of them.
We won’t do that here. Instead, we’ll look through a handful of lenses that (we thought) actually matter, at the results of India’s three biggest listed REITs. We’ll look at Bengaluru-focused Embassy, the biggest of the lot; Mindspace, the fastest-growing REIT this year, which also runs data centres; and Knowledge Realty Trust, or KRT, the newest of the three. Consider this a curious, nerdy tour of how to read their results — not a full-blown research report on the health of Indian office spaces.
At the moment, all of them are in a good place. India is in the middle of an office boom, driven by global firms setting up large captive offices here. Demand for space runs well ahead of new supply. As the tide rises, everyone’s results look strong. This presents an interesting question, however: how do three companies riding the same wave end up giving very different returns?
Let’s dive in.
Forget profit, follow the cash
By law, a REIT has to hand most of its cash — around 90% of it — back to its owners. It can’t retain earnings and reinvest them, the way an Infosys or an HUL would. That rule makes a REIT’s profit figure close to meaningless. What matters, instead, is the cash the properties throw off, and how much of it survives the journey down to you.
Instead, look at two numbers. The first is the income the buildings themselves generate: that is, rent minus the cost of running those buildings. This is their ‘Net Operating Income’ or ‘NOI’. Think of it as what the property earns before any financing or head-office costs are involved. The second is what eventually lands in a unitholder’s account — the distribution . Between those two is a long staircase of deductions, with cash leaking at every step.
The biggest leak, by far, is the interest a REIT pays on its debt.
The busiest REITs leak the most cash as interest. A building under construction has to be financed well before it earns a single rupee of rent. Even when a new building just opens, it usually comes with rent-free “move-in periods”, Accounting rules, meanwhile, spread rent out evenly across the whole lease. So, a REIT’s books may show income, even where the building isn’t yet collecting cash.
As a result, a REIT’s paper income can grow much faster than the cash it pays out — and it can stay that way for years.
This was Embassy’s story this year. Its buildings “earnings” grew much faster than its payouts. The difference came from its construction pipeline. It was building a large amount of space right now, each tower adding financing costs and paper-rent today. Meanwhile, the real cash will only show up later. As its management says upfront, this gap will stick around for a couple of years.
The complexity continues when the REIT starts releasing cash as well, by the way. We won’t get into the weeds here, but there are different ways in which a REIT can pay out to you, each of which are taxed differently. So the shape of a REIT’s distribution — and not just its size — decides how much you walk away with after tax. Two REITs can advertise the same headline payout while leaving you with meaningfully different amounts.
KRT, for instance, runs an unusually tax-friendly mix, making its payout a little more attractive than it first looks. So when you compare REITs on yield, compare them after tax, not before.
Is the growth real ?
Eventually, it is a REIT’s distribution that you’re the most interested in. That is how money actually reaches your wallet. How and why does that grow? Here are a few simple ideas to keep in mind:
First, there’s a building’s occupancy , or how full it is. This gives you the pulse of demand.
Second, there’s a REIT’s pricing power. For instance, when an old tenant moves out and a new one signs for the same floor, how much more is the new tenant paying?
Third — and the one that tells you most about the future — is the gap between what sitting tenants currently pay, and what their space would fetch at today’s market rents. Old leases, signed years ago at old rates, tell you of a building’s potential revenue growth. Some day, those leases will expire, and reset to current rates. Then, its income shall jump without the REIT having to lift a finger.
Finally, most leases come with automatic annual increases in rent.
Together, these tell you about the possible growth in earnings a REIT might see.
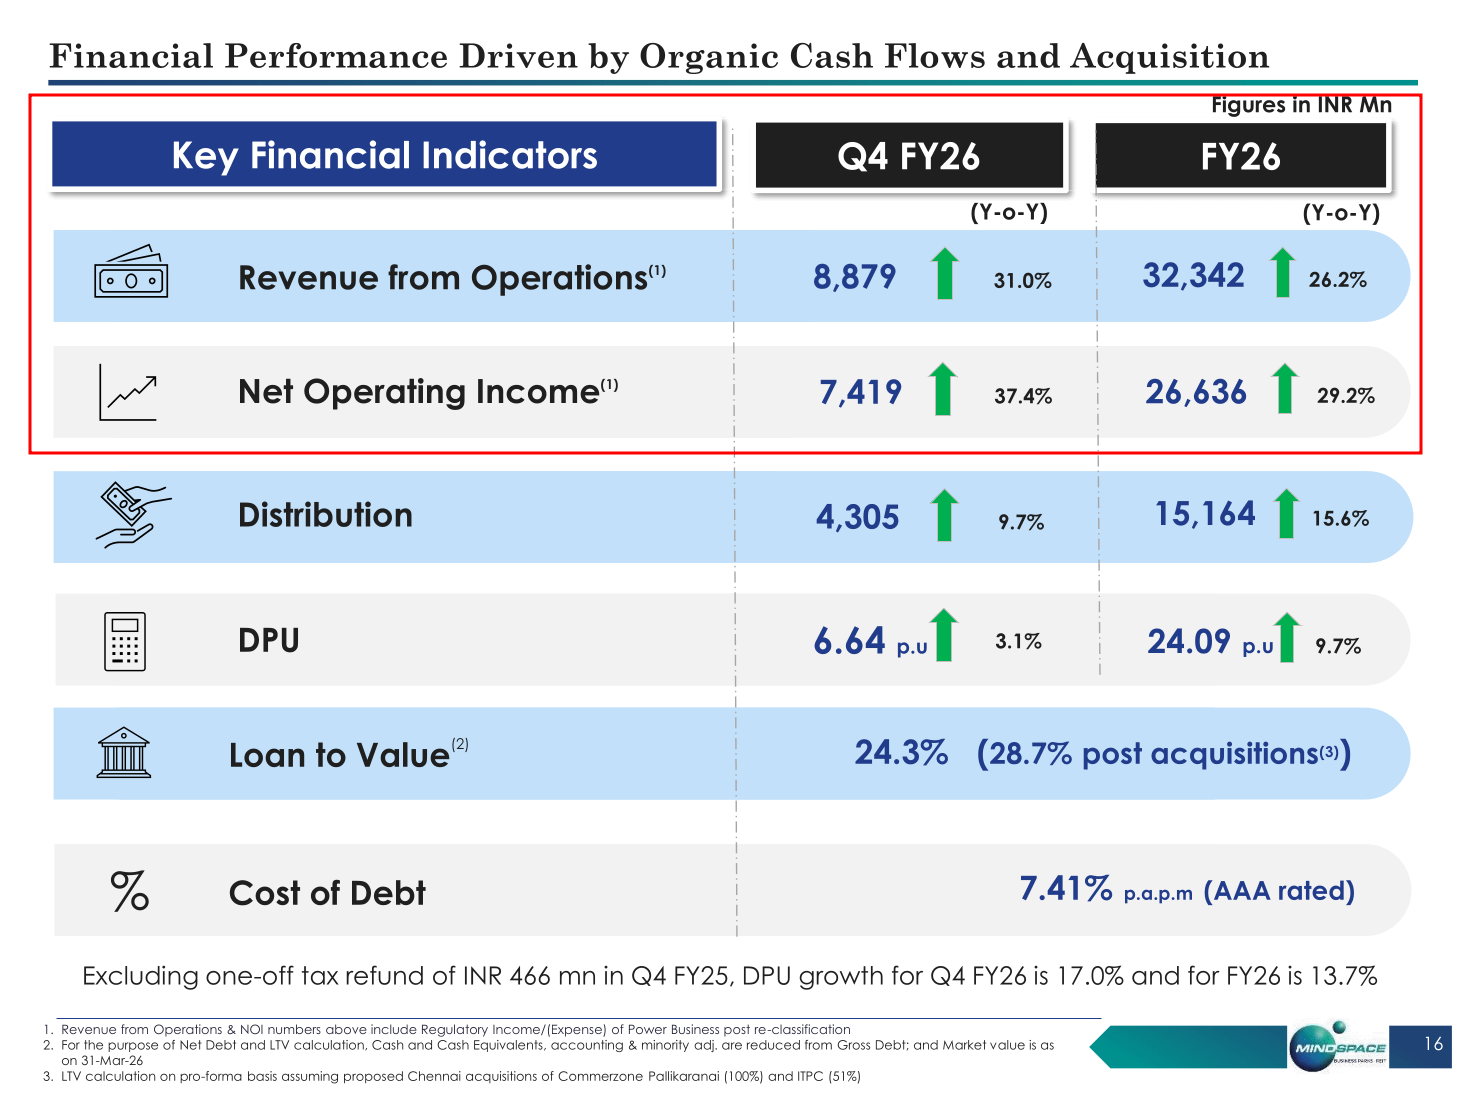
In the March quarter, of the three REITs we’re looking at, Mindspace saw its income grow the fastest, by a clear margin. This came from two things. One, it just wrapped up some acquisitions. But it also saw an unusually high reset of rents in Hyderabad. Many of its tenants had been sitting on leases far below today’s market rate. When those leases rolled over, there was a dramatic jump. New tenants paid much more than those they replaced.
Part of evaluating a REIT is spotting leaps like this in advance.
Currently, there’s still a lot of upside left to capture at KRT and Mindspace. In contrast, Embassy has already harvested much of its reversion. This is why Embassy’s growth looks more muted.
That isn’t a knock on the company. This picture could change. Market rents in Embassy’s core markets are still climbing.
The biggest cost for a REIT
As we told you before, the biggest leak between what a building earns and what you receive is interest . This makes the rate a REIT pays for its financing one of the most powerful levers for the size of your payout. Every rupee saved in borrowing costs is a rupee that flows almost straight to distributions.
There are three things that shape these costs.
One, there’s the question of how much debt it carries relative to the value of its assets. On one hand, this is a measure of risk. Flipped around, it’s also a measure of how much firepower it can generate to go and buy more buildings.
Two, there’s the direction its borrowing cost is moving in: which gives you the direction in which the lever swings.
Three, you should know how much of its debt carries a fixed rate versus a floating one. This tells you what happens if interest rates move.
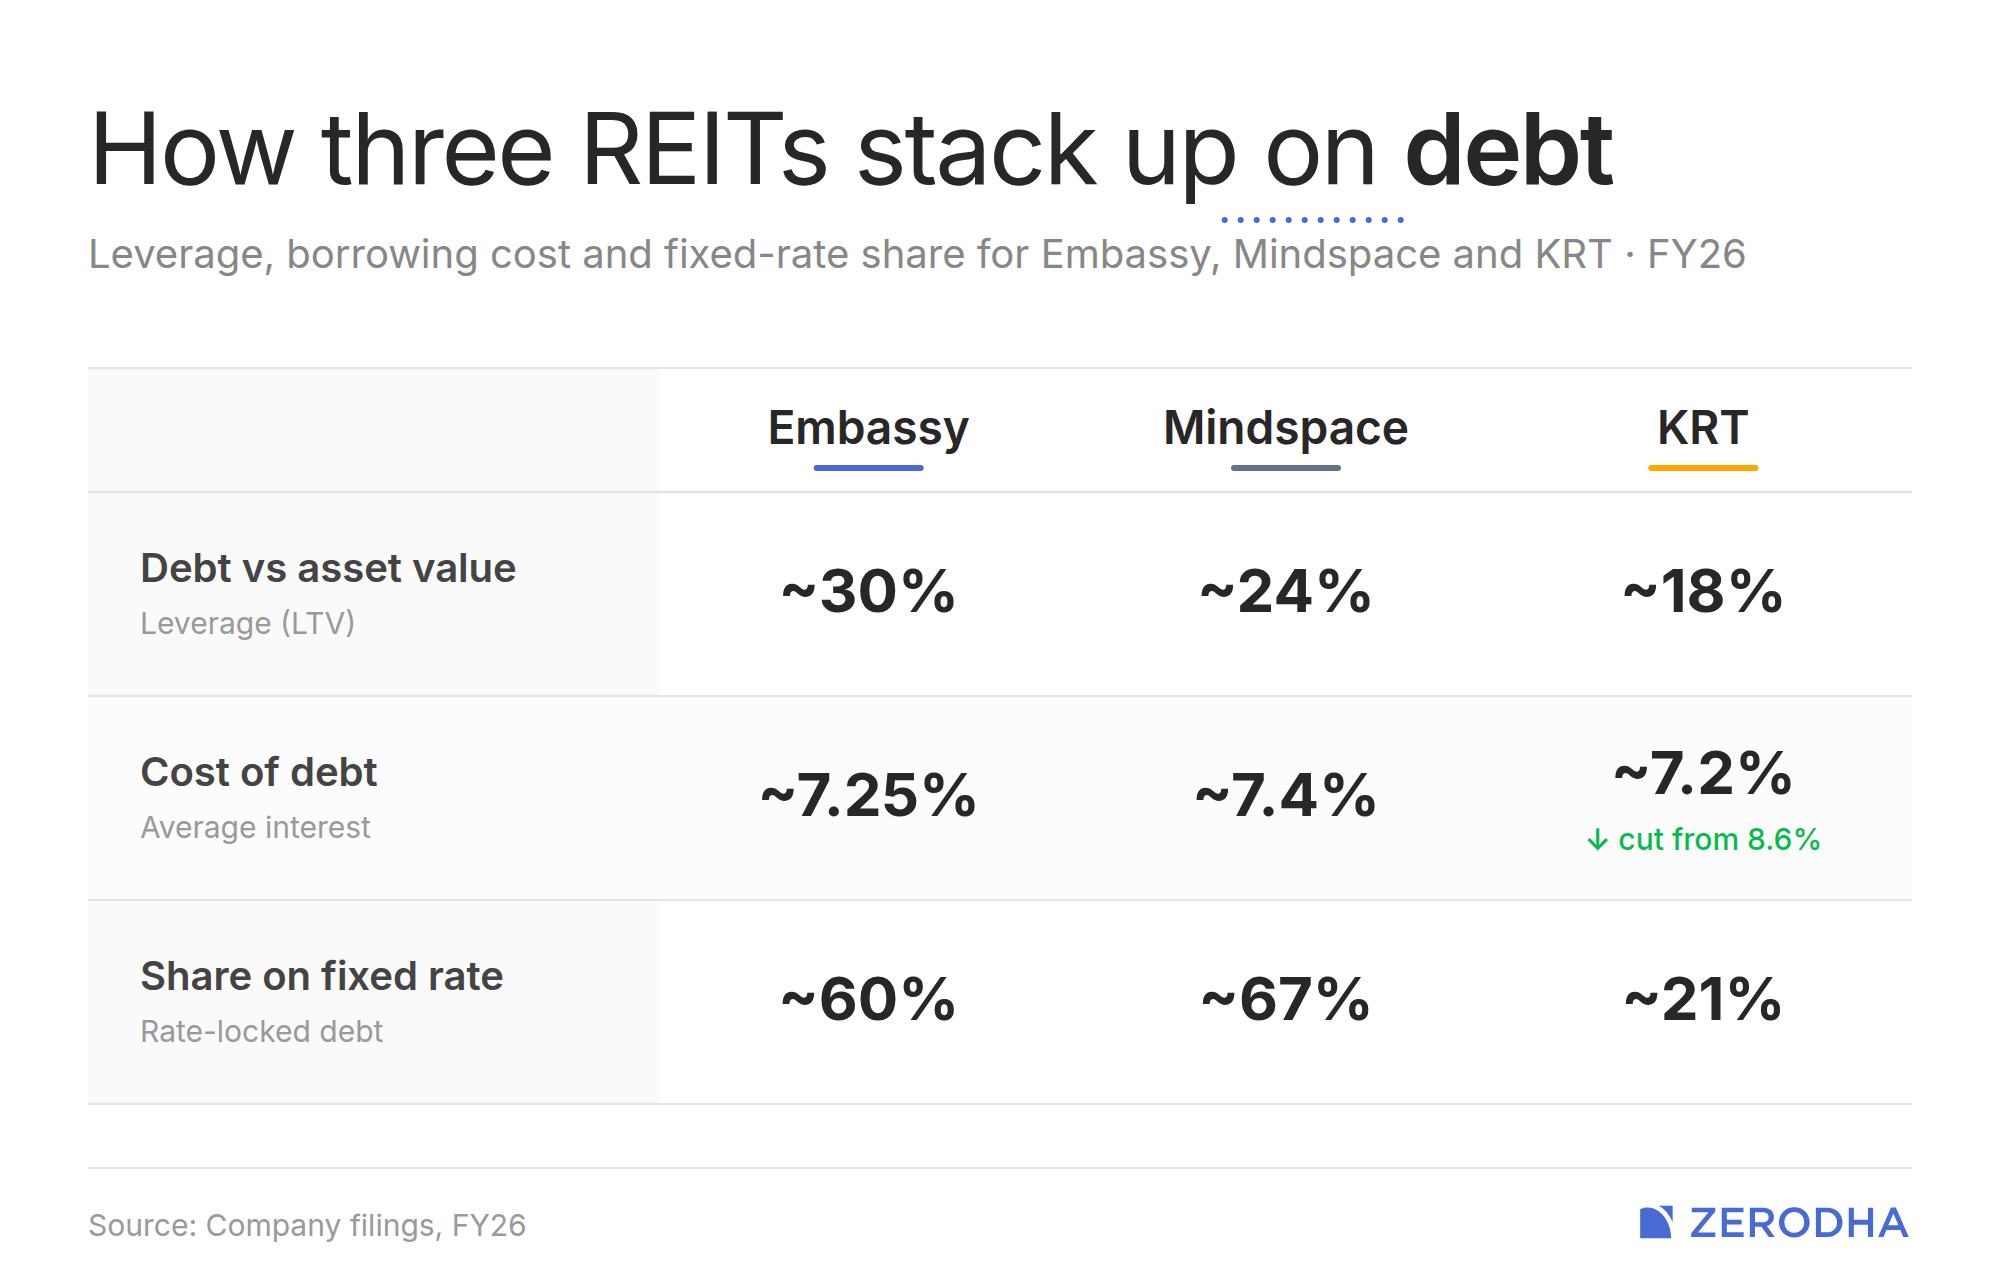
When it comes to debt, KRT presents an interesting case. It carries the least debt of the three by some margin. One, it makes it the safest . Two, it also gives it headroom to expand. As a newly listed REIT, KRT spent the year refinancing old, expensive borrowing into cheaper money, cutting its cost of debt sharply, This is a clean, visible tailwind to its payout.
That said, most of its debt floats with interest rates. If interest rates rise, its distributions could suddenly dip. Embassy and Mindspace, by contrast, have locked in more of their debt at fixed rates, so they’re better insulated. In fact, Embassy even sold the Indian REIT market’s first ten-year bond this year, lengthening its runway in the process.
That said, as borrowing costs fell, everyone’s payouts were better. This was a gift of the interest rate cycle. This isn’t something you’ll see every year. All three management teams warned that this trend could reverse if oil prices or geopolitics push inflation back up.
One bet to rule them all
Usually, when we recap a sector’s results, we think of individual companies as a proxy for entire parts of the economy. That’s more complex with a REIT, given the many things happening inside one.
And yet, there’s still a sector-sized bet hidden in there: that India will keep wanting more office space.
There’s a strong case for that. Global firms are increasingly flocking to India to set up new offices for real high-value work, which goes beyond simple back-office tasks. These tenants are sticky, and growing. Demand for office space has been running ahead of new supply for a while. Vacancies are low. For the very first time, in fact, average rents across India crossed ₹100 per square foot per month.
But there’s a bear case too, arising from two letters: AI .
If software can do the same work as armies of IT-services staff, then companies need fewer people, who in turn need fewer desks. For a sector whose tenants are largely technology firms, that’s an existential question.
So much of what we’ve discussed here — cheap debt, underpriced leases, and the like — are all temporary. Over the long term, there’s one question worth watching: does AI make India’s offices busier and more valuable, or simply emptier ?
The stress test for India’s inflation targeting mechanism
India has usually fought inflation in food prices with a set toolkit.
When onion prices spike, exports are banned. When wheat gets expensive, the Food Corporation starts selling grain on the open market. When rice runs short, export restrictions tighten. This is how we’ve dealt with food inflation for decades, using supply-side controls, trade restrictions, and fiscal adjustments. These are all government instruments.
A decade ago, though, the country added a brand new layer to this system: monetary policy. That inserts a new party — the central bank — to the mix.
In 2016, RBI adopted flexible inflation targeting (FIT), which entailed a clear mandate: keep consumer price inflation at 4%, within a tolerance band of 2–6%. An independent Monetary Policy Committee was set up and accountability provisions were written into law. The idea was that a credible central bank would anchor inflation expectations in a way that earlier interventions alone never could. As we’ve covered before, the design was rigorous. And for the first few years, it worked.
Then came the first real test.
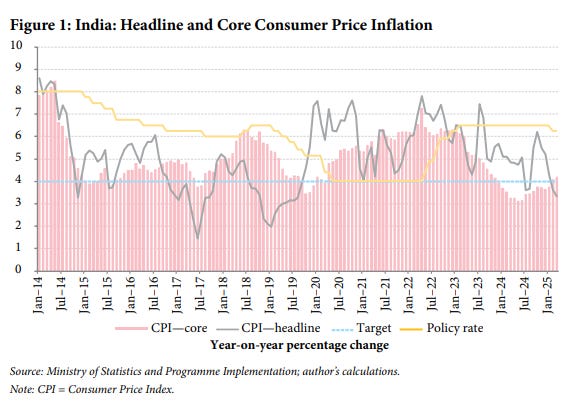
Between 2019 and 2024, inflation repeatedly breached the RBI’s upper tolerance band. Headline consumer price inflation (CPI) averaged above 5% for the entire period. The MPC had to issue a statutory constitutional explanation to the government after inflation stayed above 6% for three straight quarters as to why they had failed to keep prices in check.
What made this experience unique was that most of the inflation was driven by domestic food prices. Even after CoVID, while global food prices corrected after the pandemic, India’s kept climbing.
A new working paper by economist Renu Kohli at the Centre for Social and Economic Progress has offered a new, systematic account of this episode, and argues that what happened between 2019 and 2024 may not be an anomaly, but a preview of what’s coming.
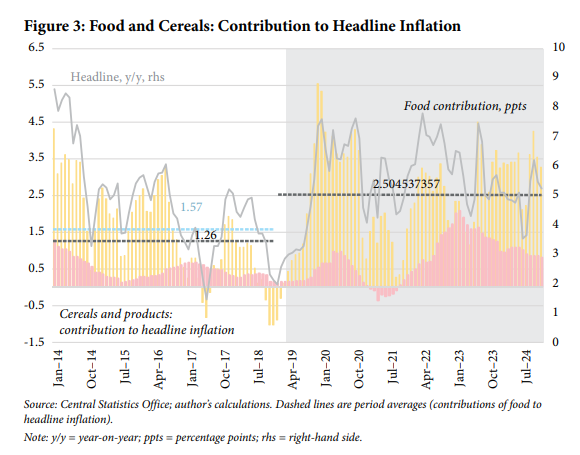
Food is the whole story
Over 2019-2024, food inflation averaged 8.4% over 2019–2024. Headline inflation, by comparison, only averaged 5%. On average, food prices added 2.5 percentage points to headline inflation every month during this period, compared to 1.6 percentage points in the five years before. That’s a massive shift in the composition of what’s driving prices up.
It wasn’t the result of one bad quarter or one spoiled harvest. Cereals alone, which hold a weight of just over 12% in the CPI basket, accounted for nearly a fifth of total inflation between 2022 and 2024. Vegetables also collapsed repeatedly. The food price index rose more than 50% in those 5 years.
What made this episode different from India’s historical food inflation bouts was the dynamics.
See, in the past, food price spikes tended to be mean-reverting. What that means is that if prices would surge after a bad monsoon, they would correct within a few months as the next harvest came in. But that pattern broke down in this period. After 2019, spikes got bigger, more frequent, and corrections got weaker. The paper documents that price surges became bigger and lasted longer. And while the pandemic disruptions also contributed to this, this effect largely faded by late 2022.
Meanwhile, something strange was happening on the other side of the inflation ledger.
Core inflation, which strips out food and fuel, crashed to a historic low of around 3% by May 2024. The gap between headline and core inflation averaged 148 basis points in 2024, more than three times the historical average of 47 points.
This was no statistical curiosity either. It meant that the non-food economy was cooling rapidly, while the inflation number the RBI is legally bound to target kept flashing red because of food. It created a genuine policy dilemma: headline inflation was too high to cut rates, but core inflation was signalling an economy that desperately needed relief.
When the weather turned
The persistence of food inflation wasn’t a monetary policy failure, though. It was almost wholly a climate story.
Kohli traces the food price pressures to a cascade of extreme weather events that has few historical parallels. Successive heatwaves and significant deficits of rainfall damaged wheat crops and vegetables for three consecutive years between 2022 and 2024. In fact, in 2023, something unprecedented happened: both winter and summer crops — wheat and rice, the two pillars of India’s food security — were disrupted simultaneously. That had not occurred in the previous two decades.
As a result, wheat procurement collapsed by roughly 40% over the episode, and public wheat stocks fell 70%. Official and private estimates of wheat production diverged sharply, adding a layer of uncertainty to an already strained system.
The paper also flags an emerging pattern: statistically, hotter years now correlate more strongly with weaker monsoons than they did historically.
That points to more compounding risks, and less isolated bad luck. In the author’s view, this matters because the standard monetary policy response to food price shocks assumes the shocks are temporary. The RBI’s playbook is to hold rates steady, wait for the next harvest, and let prices correct on their own. That logic falls apart when the next harvest is also bad.
In essence, how does monetary policy solve a problem that channels itself through global warming?
The state intervenes
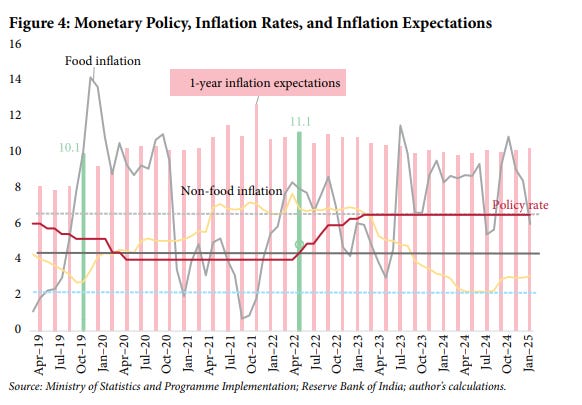
When food prices started rising in late 2019, the MPC held rates and kept its stance accommodative, betting that supplies would normalise. When the pandemic hit in 2020, the RBI cut rates further and flooded the system with liquidity, which amounts to about 8.7% of GDP in targeted support.
But by mid-2021, food inflation was entrenched, household inflation expectations had crossed 12%, and most emerging economy central banks had already started tightening. India didn’t begin raising rates until May 2022 — nearly a year behind.
In the meantime, government interventions filled the vacuum. The scale of supply-side intervention during this period was extraordinary. Export bans on wheat and rice, stockholding caps on traders and processors, open market grain sales, tariff adjustments, fuel duty cuts, a freeze on retail pump prices — the full arsenal was deployed. The number of agricultural market interventions went from 5 in 2019–20 to 12 in 2021–22 to 28 in 2023–24. At the peak, the government was announcing more than two interventions a month.
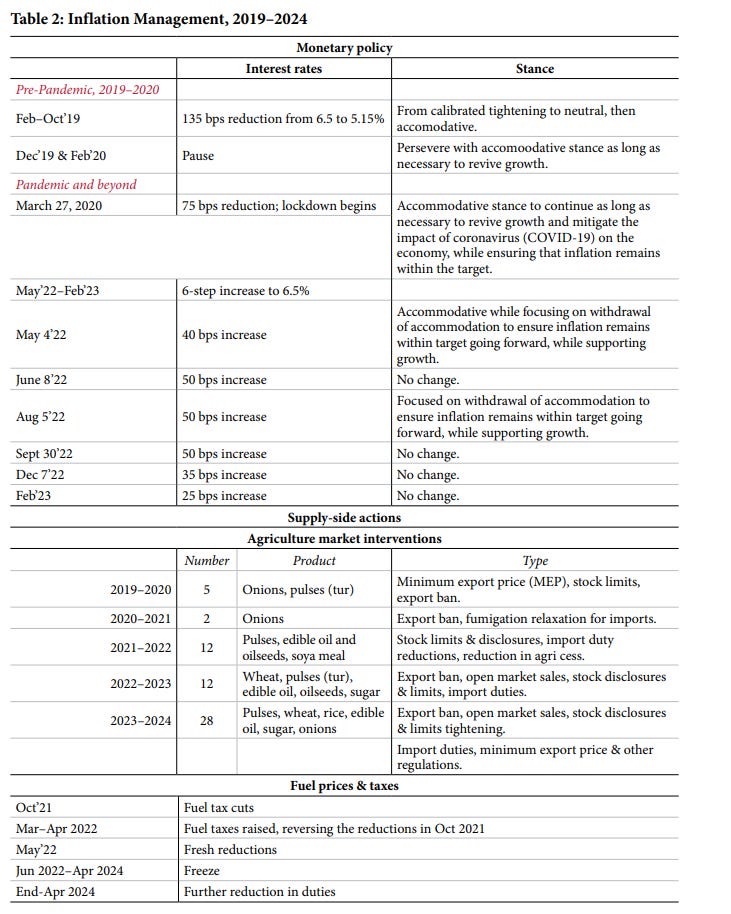
The cuts also partly worked. As per the RBI, the fuel duty cuts lowered headline inflation by about 1.5 percentage points. Core inflation came down too.
But food inflation barely budged. Despite all the agricultural interventions, food price growth exceeded 6% in most months for over five years from its initial surge. It’s worth noting that whatever disinflation India did achieve in 2023 was driven almost entirely by the energy side — the fuel duty cuts and the pump price freeze effectively reversed the previous year’s trend.
The controls may have prevented sharper spikes, but they didn’t break the inflationary inertia. After all, climate change is not a factor in their control.
Some of the controls produced their own market distortions, too. For instance, stockholding caps reduced trader participation at price-stabilising auctions. Then, the divergence between official and private wheat production estimates fuelled confusion in markets.
The RBI’s own forecasting struggled to keep up. In April 2022, the RBI projected inflation would decline steadily over the coming quarters to 5.7% for the year. But the actual inflation in March and April came in at 7% and 8%. By June, the annual forecast was revised upward by a full percentage point to 6.7%.
That’s not normal forecast uncertainty. That’s a framework that was systematically underweighting the persistence of food shocks. But moreover, as we shall see now, it also reveals that the inflation targeting framework was heavily reliant on the success of the government’s actions.
Whose expectations are they anyway?
The MPC minutes from 2021 and 2022 are very revealing about how the inflation targeting mechanism worked in practice.
They contain repeated requests for fiscal adjustments on the part of the government — like fuel duty cuts and price ceilings — to help anchor inflation expectations that the RBI’s own tools couldn’t reach. The central bank ran special surveys of household inflation expectations after the government announced tax cuts, effectively measuring whether the finance ministry’s actions had done what monetary policy could not.
But this muddles the fundamental idea of inflation targeting. The whole architecture rests on the central bank being seen as the credible, independent anchor. When the anchor’s effectiveness depends on whether the government bans onion exports in time, that credibility frays.
And the paper offers a striking piece of econometric evidence on this point, too. Kohli found that compared to 2014-2018, inflation became more sensitive to food shocks under FIT, not less . In the earlier period, the response was statistically insignificant — food shocks didn’t meaningfully move headline inflation. In the later period, the pass-through was large and highly significant. That’s the opposite of what a maturing inflation targeting framework is supposed to deliver.
Inside the MPC, disagreements sharpened. Some members argued the growth sacrifice from keeping rates elevated, while food inflation raged beyond their control, had become unacceptable. The government’s chief economic adviser publicly questioned whether headline CPI was even the right target for a country so vulnerable to food price volatility. That kind of questioning, during a prolonged inflation overshoot, risks undermining the framework’s institutional legitimacy at precisely the moment it needs it most.
Conclusion
The 2019–2024 episode exposed a structural vulnerability at the heart of India’s monetary framework: the thing that keeps driving inflation — food prices — is the one thing interest rates couldn’t fix.
And the climate trends that made food inflation so persistent are intensifying, not receding. Temperatures are hitting new records more frequently. Simultaneous disruptions to winter and summer crops, once unthinkable, have now happened. The policy arsenal of export bans and stock limits is showing diminishing returns.
The implication is clear: either the monetary framework adapts to a world where supply shocks are structural rather than temporary, or India’s agricultural markets get the reforms that would make them less vulnerable to climate volatility. The second option may not be likely to happen anytime soon. And no one has a good answer for the first.
Tidbits
-
The Coal Ministry has notified the Coal Exchange Rules, 2026, laying the groundwork for electronic coal trading with formal price discovery — similar to exchange-based systems in other commodity markets. The rules mandate a minimum net worth of ₹50 crore for exchange operators, cap individual ownership at 5%, and require existing electronic coal trading platforms to register within six months or shut down.
2.Source:* Business Standard -
At TCS’s annual general meeting, Chairman N Chandrasekaran said the company could eventually have as many AI agents as its ~500,000 employees, working alongside humans. TCS won’t lay off existing staff but will slow hiring as tasks get automated; its annualised AI revenue has already hit $2.5 billion, growing at a compound quarterly rate of over 22%.
4.Source:* Reuters -
Adani Energy will purchase 100% of IntelliSmart Infrastructure, a smart-metering JV between NIIF and EESL, for ₹3050 crore. IntelliSmart currently owns and operates over 2.2 crore meters across UP, Gujarat, MP, Bihar and Assam, and its revenue jumped from ₹243.5 crore in FY24 to ₹621.3 crore in FY25. This acquisition will take Adani’s total smart meter portfolio past 4.7 crore units, making it the largest smart meter player in India.
6.Source:* Economic Times
- This edition of the newsletter was written by Kashish and Manie.
What we’re reading
Our team at Markets is always reading, often much more than what might be considered healthy. So, we thought it would be nice to have an outlet to put out what we’re reading that isn’t part of our normal cycle of content.
So we’re kickstarting “What We’re Reading”, where every weekend, our team outlines the interesting things we’ve read in the past week. This will include articles and even books that really gave us food for thought.
 Subtext by Zerodha
Ajay Srivastava on India’s place in the fracturing global trade order
The rules-based world trade order as we know it is fracturing, with weaponized tariffs and every country scrambling to secure its place in the new paradigm. We recently spoke to Ajay Srivastava, founder of the Global Trade Research Initiative and a former Indian Trade Service official, to make sense of how India is navigating this high-stakes shift. Our conversation dives deep into what Trump’s tariffs actually mean for global trade, why Bangladesh massively outperforms India in garment exports despite fewer resources, why India’s software giants haven’t made a serious bet on AI, and the broken links in India’s textile supply chain. Do give it a listen!
Thank you for reading. Do share this with your friends and make them as smart as you are ![]()