But I’ve found data that contradicts the above statement, and hence makes the data un-reliable.
For e.g.
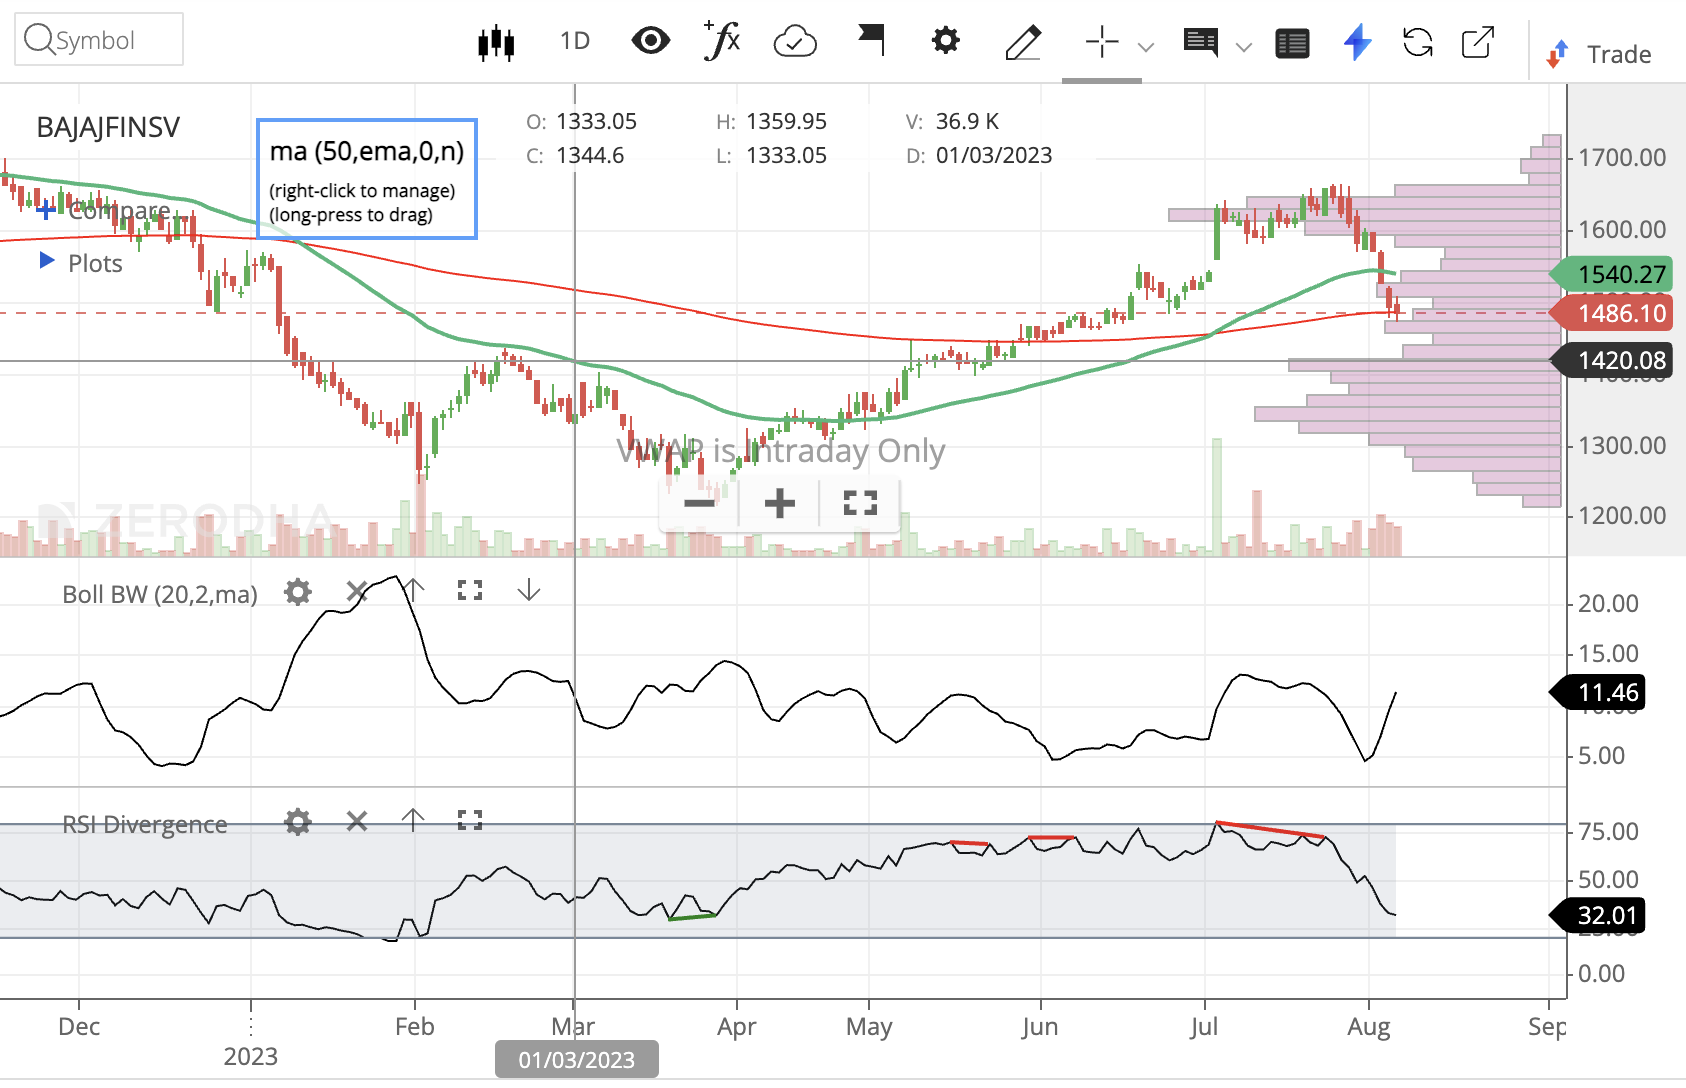
“BAJAJFINSV” on 01-Mar-2023, Total Traded Qty: 36,871, Block Deal Qty: 7,43,000.
“ADANIGREEN” on 02-Mar-2023, Total Traded Qty: 60,180, Block Deal Qty: 2,70,24,619.
Seems the data for your “Total Traded Qty” is coming from BSE and “Block Deal Qty” is coming from NSE. Bhavcopy of NSE and BSE are different and block deals can also happen on either of the exchanges. Each exchange’s Bhavcopy volumes will indicate block deals done on their respective exchanges.
NSE Chart Above. Notice the V: 1.13 M. Seems about right considering the Block Deal Qty you mentioned.
Reliability is a totally different ball game but if you are after that combining the volumes across NSE and BSE will give a much better picture. Something no chart or site does at the moment - that I am aware of.
I too think the same. If we look into the respective exchanges Bhav Copies, then they will include all this volume which has happened in the Block Deals during that trading session.