Hello and welcome to this special edition on the eve of the Union Budget 2026.

I’m Sandeep Rao—and this is a newsletter focused entirely on how markets behave around Budget day, and how, as traders, we can think about positioning ourselves.
The Union Budget is one of those events where economics, policy, politics, and markets collide within a single trading session. For those prepared, it’s a day of opportunity. For others, it’s a day of heightened risk.
I know it can be a crazy day in the markets—headlines are flying, expectations are running high, and every sector seems to have a narrative attached to it. But if you’re anything like me—someone who lives and breathes the markets—Budget day is impossible to ignore.
In this newsletter, I’ll walk you through how markets have historically behaved around Union Budgets, what actually matters versus what’s just noise, and the kind of trading frameworks that make sense in this high-volatility environment.
Our focus would be on understanding the market structure, volatility, risk, and potential opportunities—so that, whether you choose to trade or stay out altogether, you do so with intent.
With that context, let’s get started.
Understanding the Union Budget
As I always do, first things first—what exactly is the Union Budget, how is it different from an Interim Budget, and why does it happen on the 1st of February?
The Union Budget is the government’s full annual financial statement. This is where key fiscal policy decisions are taken—from government spending and borrowing plans to direct and indirect tax changes—these are decisions that shape how the economy, corporate earnings, and markets evolve over the next year.
An Interim Budget, in contrast, is presented in an election year and is largely a stop-gap arrangement. It usually avoids major policy or tax changes and focuses on continuity until a new government presents a full Budget. That distinction is important for markets because Full Budgets tend to carry more information, more uncertainty, and possibly more volatility.
The Budget is presented every year on the 1st of February. Historically, it used to be presented at the end of February, but this changed in 2017 to allow for a longer window of time before the start of the new financial year in April.
In this edition, we’ll approach the budget day using data-driven insights. In fact, one of the interesting patterns we’ll see later is that Budget-day market moves tend to emerge more clearly in the second half of the day—something the data highlights quite consistently.
Disclaimers
Disclaimer: This edition is strictly for educational and illustrative purposes only. Nothing discussed here should be construed as a recommendation, investment advice, or a solicitation to trade.
Trading in derivatives involves significant risk and can result in the complete loss of capital. The examples and data presented are meant to explain market behaviour, not to suggest that similar outcomes will occur in the future.
Also, a basic understanding of options and derivatives is assumed to fully follow the concepts discussed in this episode.
Calendar Returns: January and February Performance
Let’s start by looking at how the broader market performs before and after the budget day.
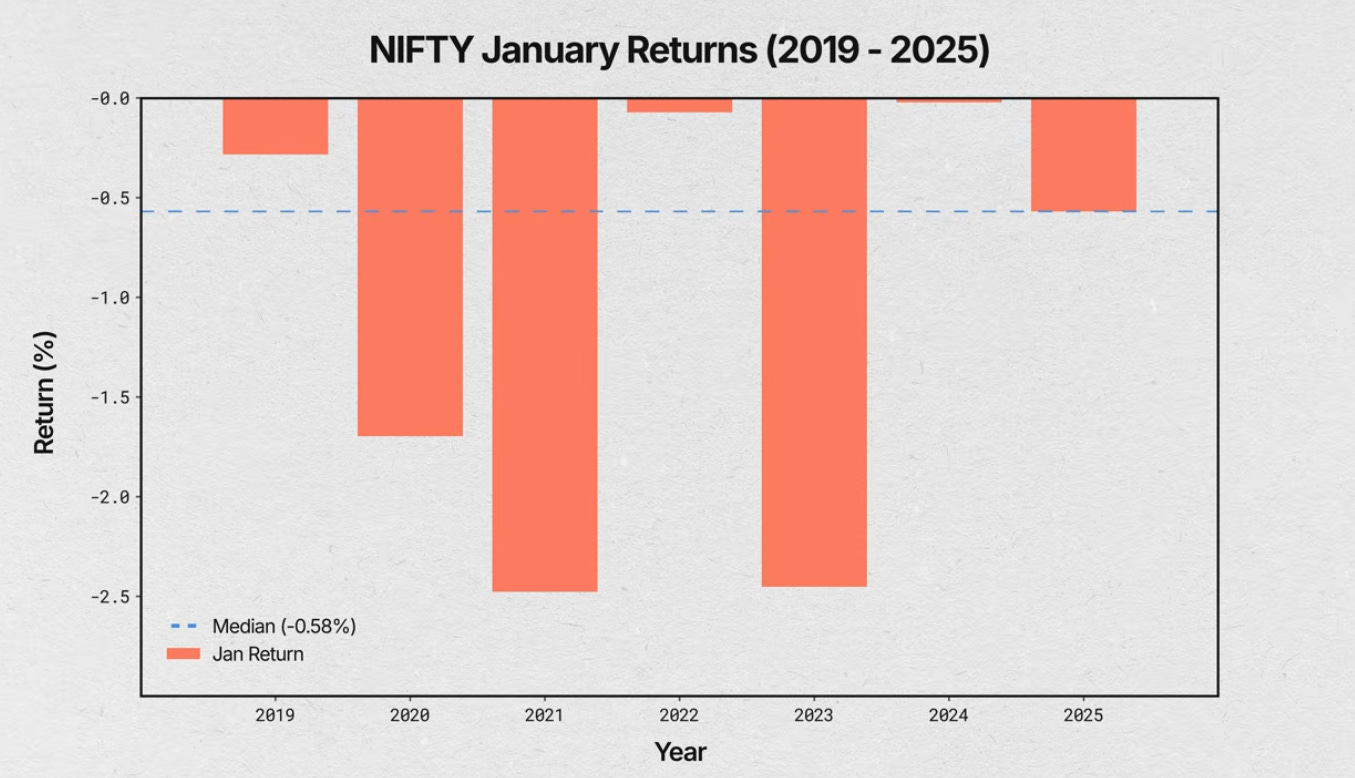
Take a look at this bar chart showing January returns since 2019. The median is actually negative. That said, this is a small sample size of just about seven observations, so it’s important not to over-interpret it.
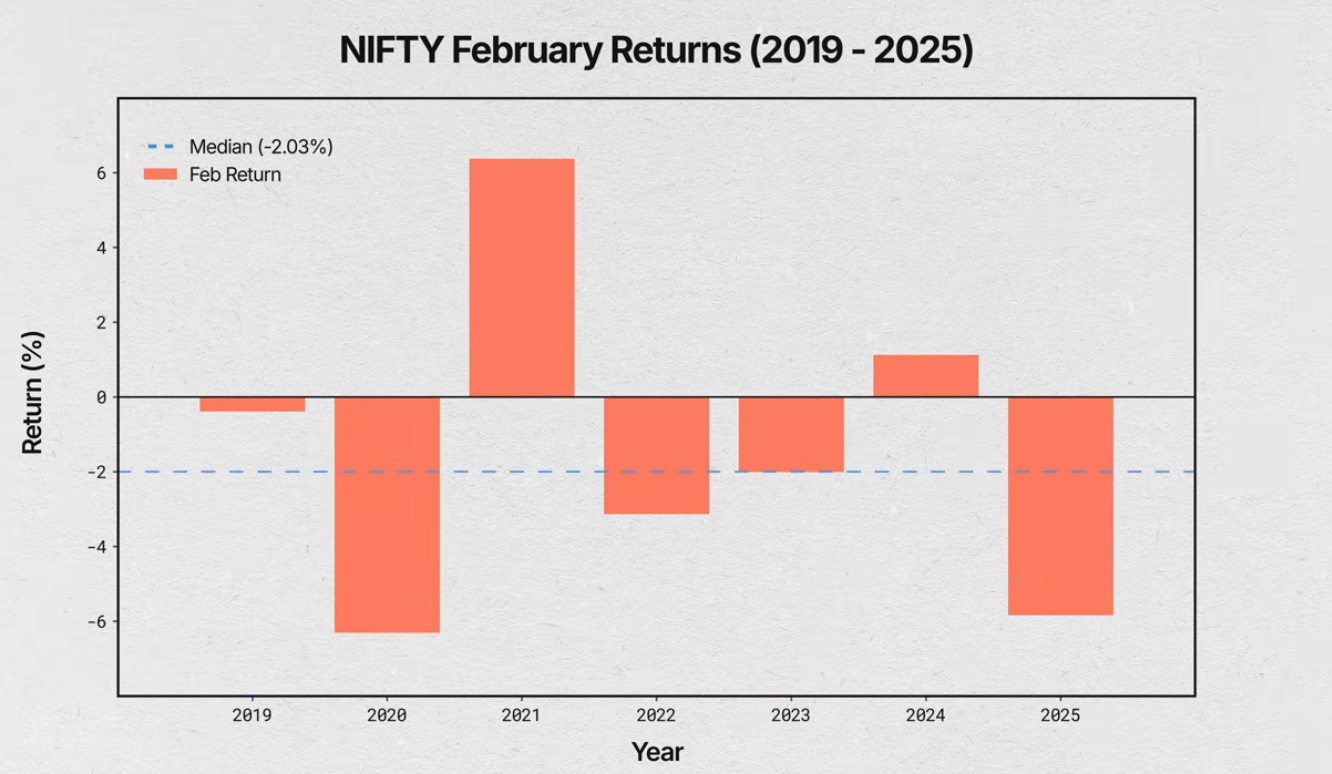
Now, if we move to February, the picture doesn’t improve. February returns are weaker than January, with a median close to –2%.
So from a simple calendar-return perspective, there isn’t much of an edge here. And on a lighter note, it does seem like Indian markets are rarely in a celebratory mood around the Budget.
Perhaps it’s the uncertainty—the lack of clarity on policy, taxes, and spending—that pushes both investors and institutions to reduce risk ahead of the event, resulting in negative returns in January and February. Or perhaps there’s no single explanation at all. Sometimes, the most honest answer in markets is simply that there is seldom one single reason for what happens.
India VIX: The Volatility Build-Up
Next, let’s move to India VIX and see how the market prices volatility ahead of the Budget. I have covered the last nine Union Budgets, including the two interim budgets in 2019 and 2024, as a part of the data set.
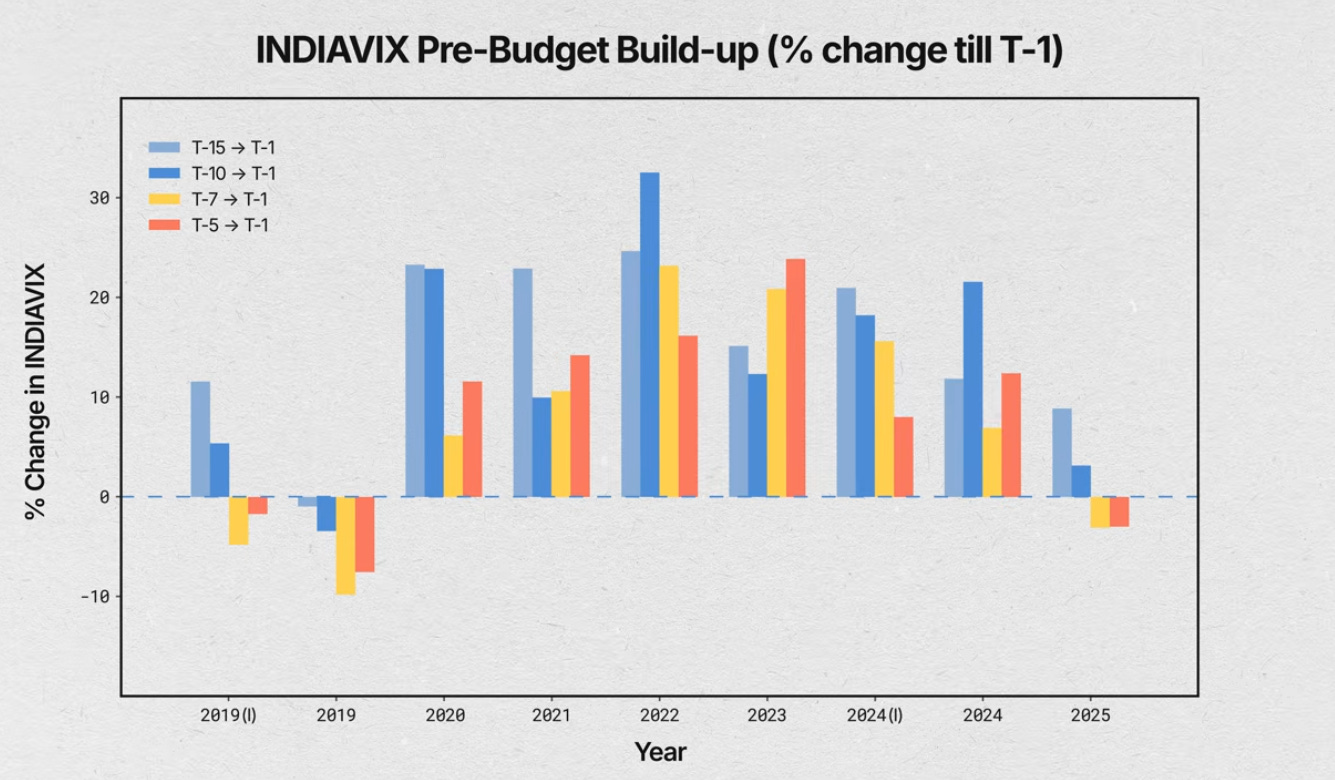
What I’ve done here is look at five different pre-Budget time windows:
- The first is 15 trading days before Budget day, or T-15 to T-1—meaning up to the day just before the Budget—shown by the light blue bar
- The second is 10 trading days before Budget day, shown by the darker blue bar
- Then we have 7 and 5 trading days before the Budget, represented by the yellow and red bars respectively
The core idea here is simple: to understand how options traders price in volatility as the event approaches.
What stands out is that the larger time windows are far more consistent than the shorter ones. If you’re looking to capture a gradual build-up in volatility, the T-15 and T-10 windows offer much more reliable signals than the last few days heading into the Budget.
Traders can use long volatility or long vega strategies like long straddles and long strangles, as well as debit spreads, long calendar spreads, and diagonal spreads, which benefit from a rise in implied volatility ahead of the event.
Testing a Long Strangle Strategy
To get a better sense of the odds of volatility expansion before the budget day, I tested a simple positional strategy. The idea is to deploy a Long Strangle with strikes 2% away from spot. Entry is at T-5 at 9:15 close, and exit is at T-1 (the day before the budget day) at 15:29. There is no stop loss applied in this.
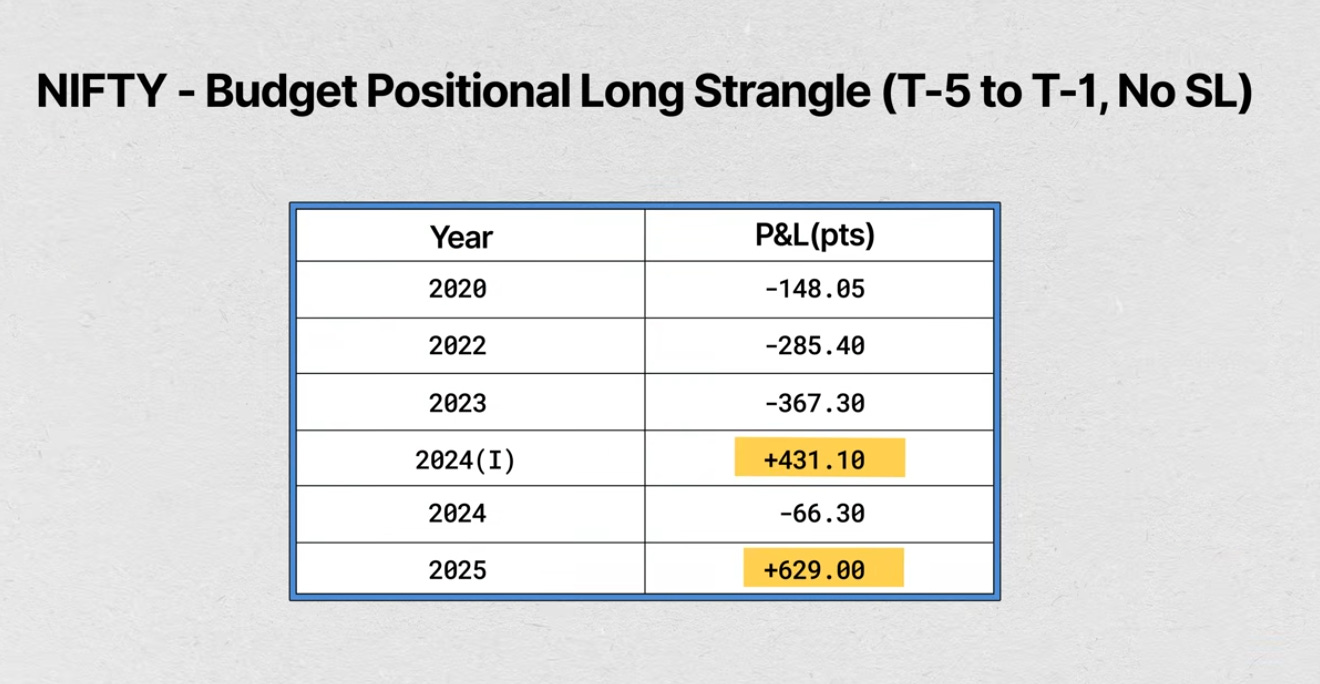
As you can see in the table, there are years where it worked quite well. But it’s not as consistent. Perhaps it works better on a longer window. We don’t have that kind of time this time around, so perhaps next time.
Budget Day: The Volatility Collapse
Next, let’s look at Budget-day percentage moves in NIFTY versus India VIX, measured from the previous day’s close to the Budget-day close.
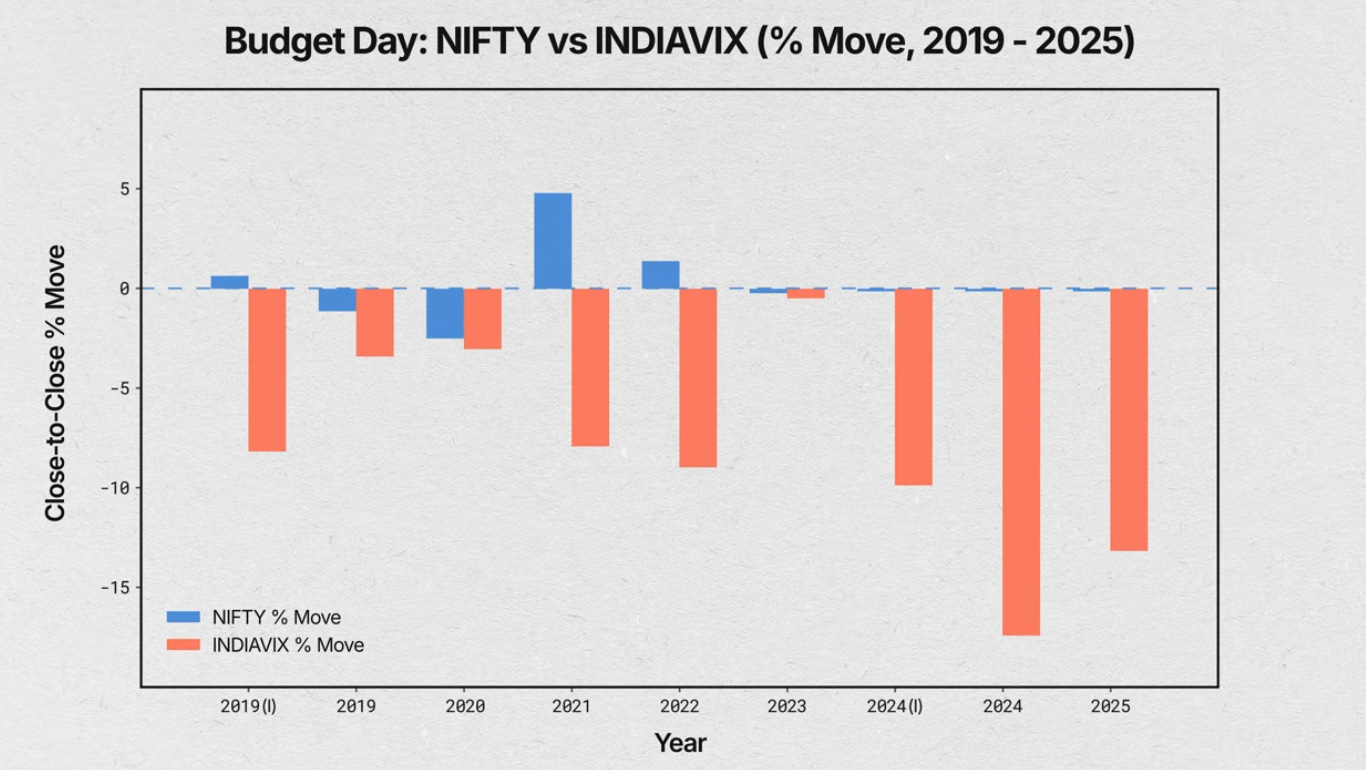
One thing becomes immediately clear—regardless of whether NIFTY moves up, down, or barely moves at all, India VIX almost always closes lower on Budget day. In other words, once the event risk is gone, implied volatility tends to compress—a classic case of uncertainty being resolved.
Understanding Intraday Range
One of the key considerations when trading short straddles or strangles is the extent of the intraday move the market can make. To gauge that, let’s look at the intraday range of NIFTY and India VIX on Budget days.
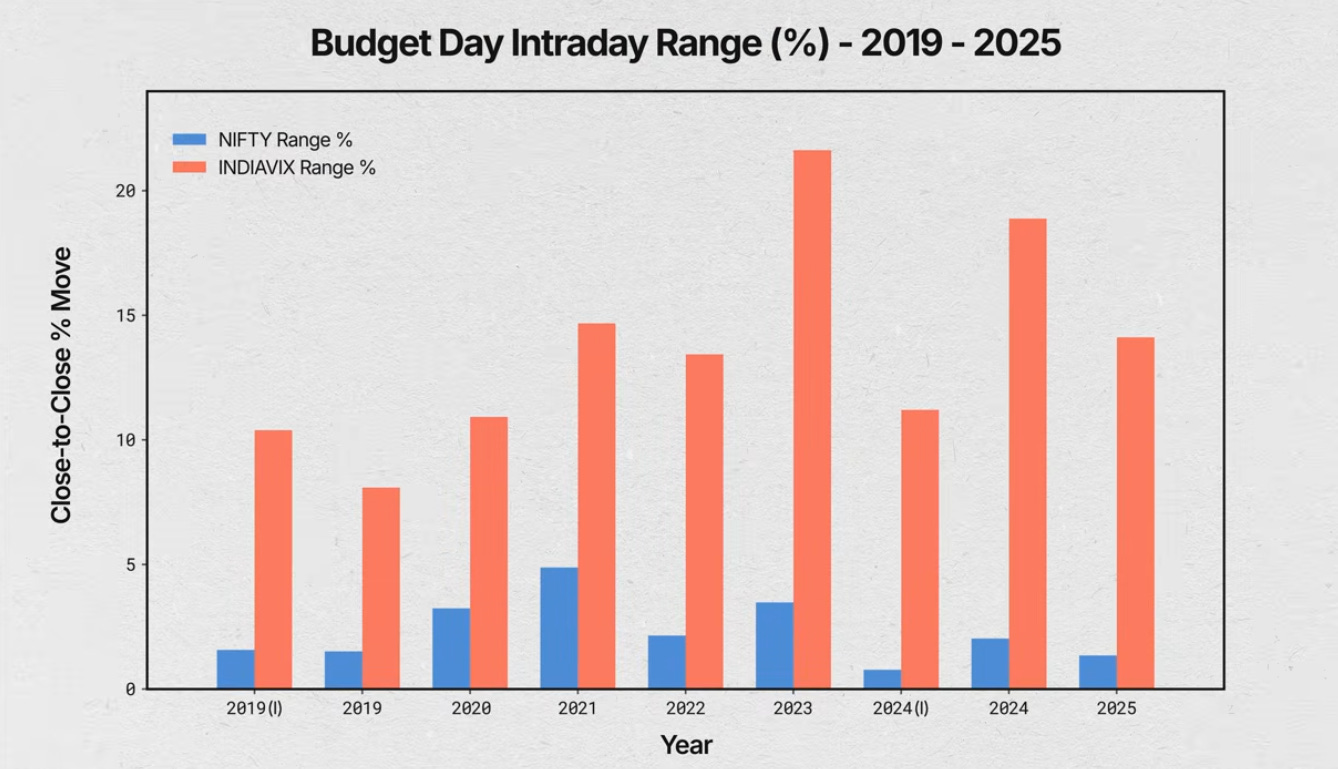
For NIFTY, the intraday range on Budget days has varied from about 0.8% to as high as 4.9%, with a median range of roughly 2.07%. If you’re deploying short strangles, this range becomes a useful reference point—it helps in deciding how wide your strikes need to be in order to absorb typical Budget-day moves without getting impacted.
Intraday Session Analysis
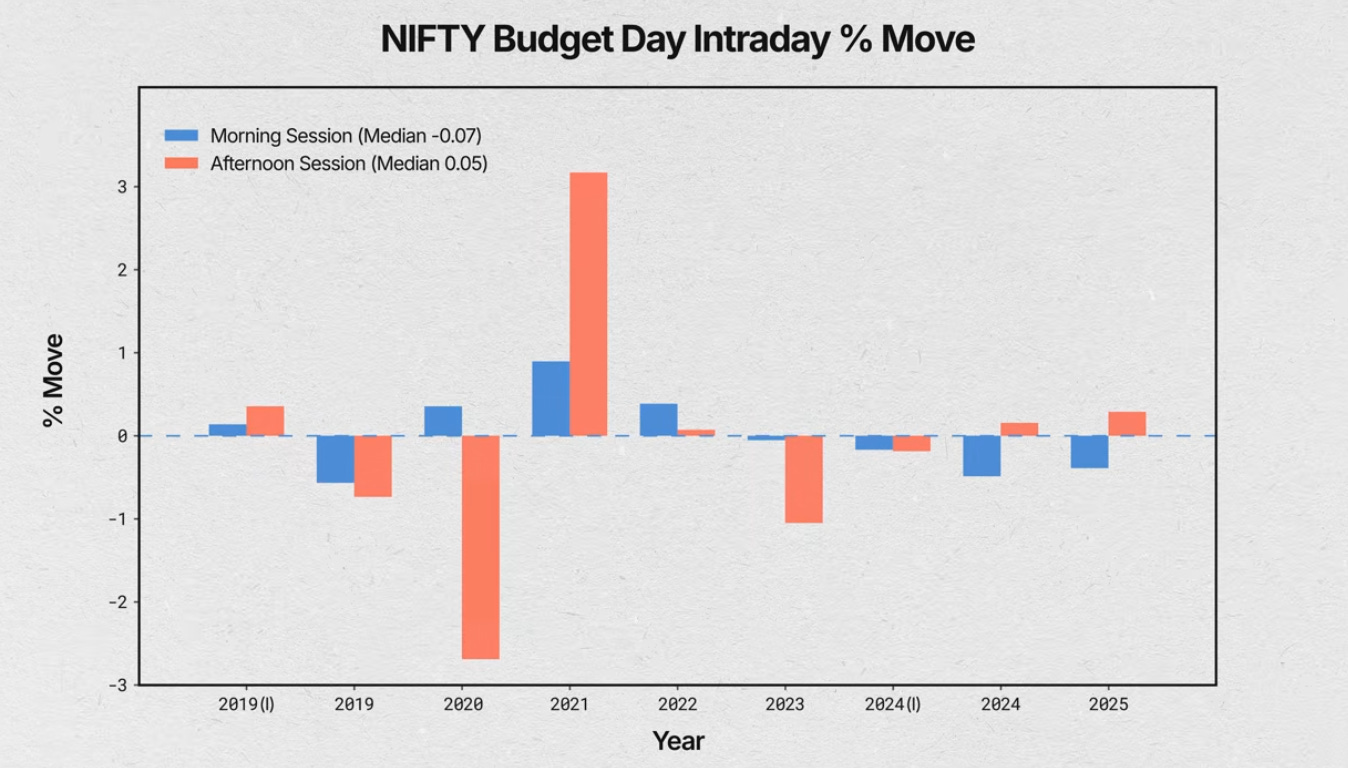
Now let’s go one level deeper and look at Budget-day behaviour on an intraday basis. What I’ve done here is split the trading day into two sessions—the morning session from 9:15 to 12:00, and the afternoon session from 12:01 to 3:30—and then calculated the price change for each session separately.
Once again, there isn’t a strong or consistent pattern. Mornings have tended to be slightly more volatile than afternoons over the past couple of years, but that’s not something I’d read too much into or try to build a rule around.
Translating Insights Into Trading Setups
So far, we’ve looked at how NIFTY and India VIX behave across months, weeks, and on Budget day itself, which gives us a reasonable sense of the market’s structure around this event.
The most consistent takeaway is clear—India VIX tends to build up into Budget day and then collapses soon after the event risk is removed. The natural question then becomes: how do we translate this understanding into simple, rule-based trading setups?
For now, I’ll focus purely on intraday setups.
Short Straddle with Fixed Leg-Wise Stop Loss
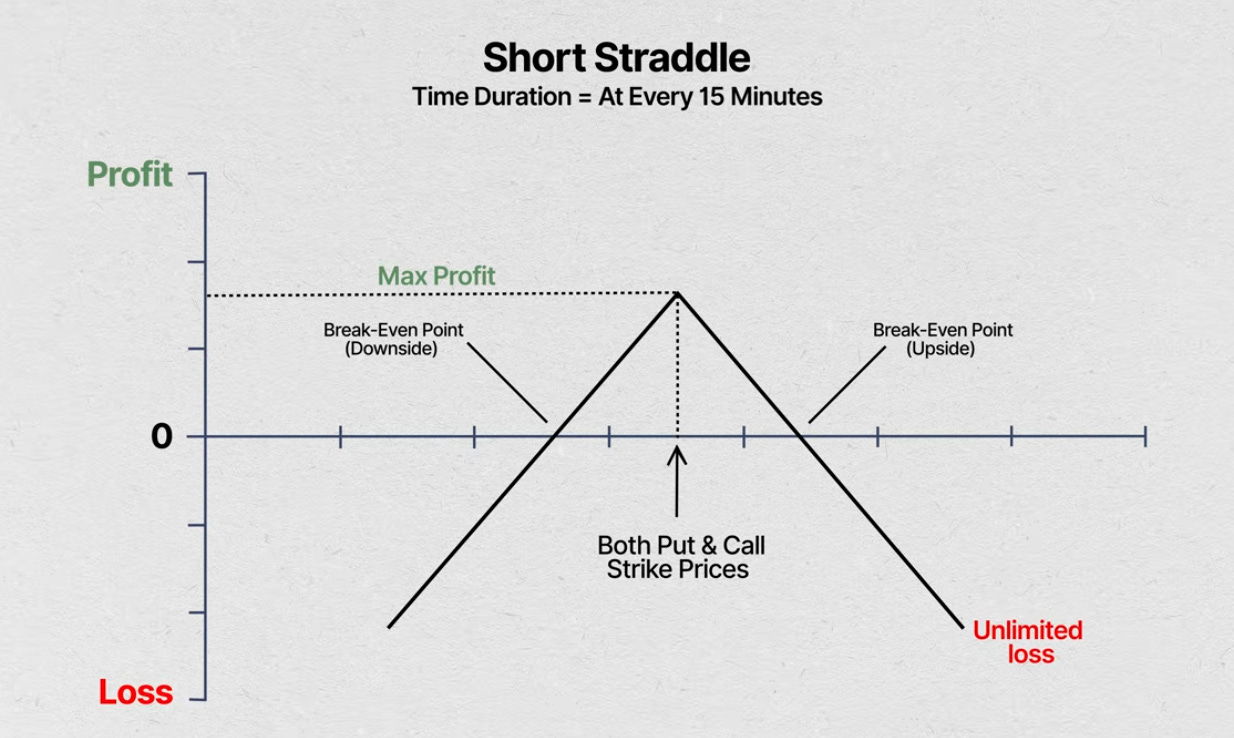
Here’s the first hypothesis I tested: sell an at-the-money straddle at fixed 15-minute intervals and evaluate how it performs. The objective is to see whether certain intraday time windows consistently offer a better edge than others.
We’ll explore two variations of this setup. The first uses a fixed stop-loss of 20% on each leg of the straddle.
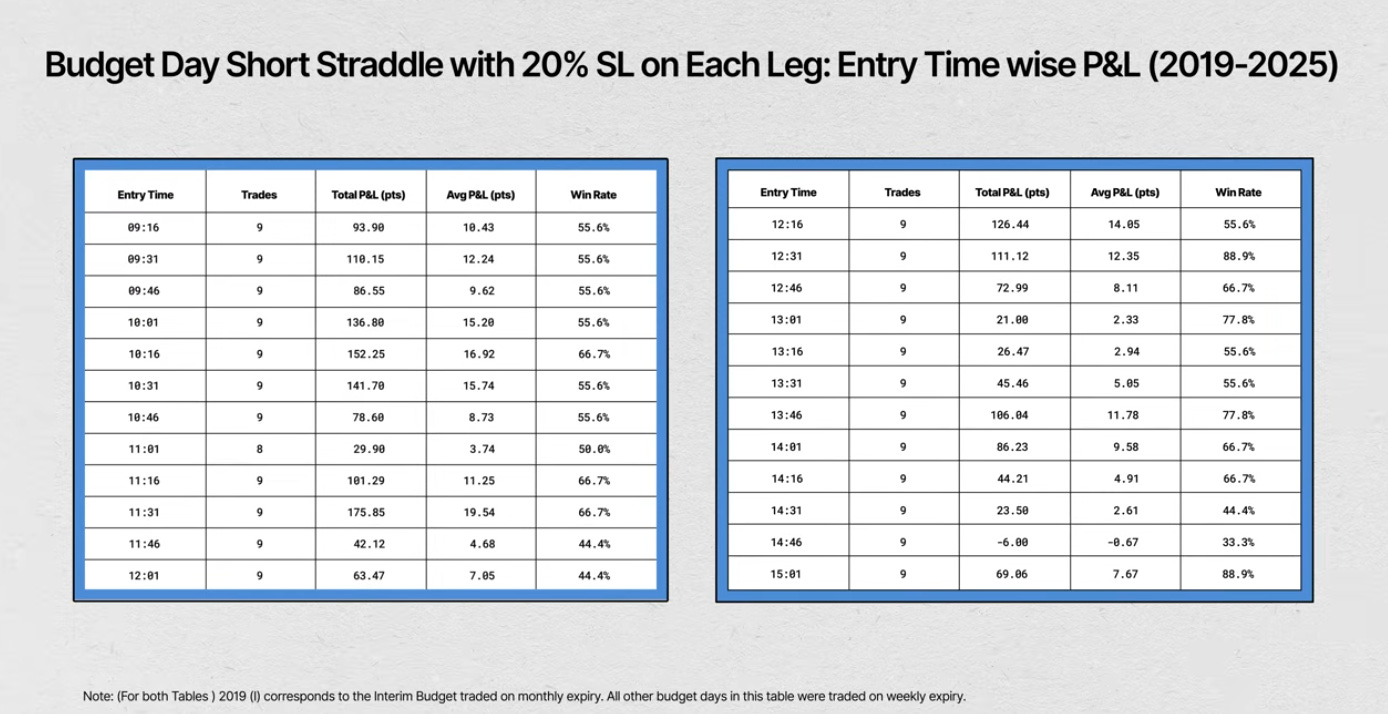
If you simply look at the win rates, two time windows stand out—the 10:00 to 10:30 window, and the broader 11:15 to 13:00 window. These periods show relatively better consistency compared to the rest of the trading day. So if you’re considering deploying intraday straddles on Budget day, these time windows may be worth paying closer attention to.
Short Straddle with Combined Premium Stop Loss
Next, we repeat the same exercise but with a combined premium stop-loss of 20%, applied to the total straddle premium.
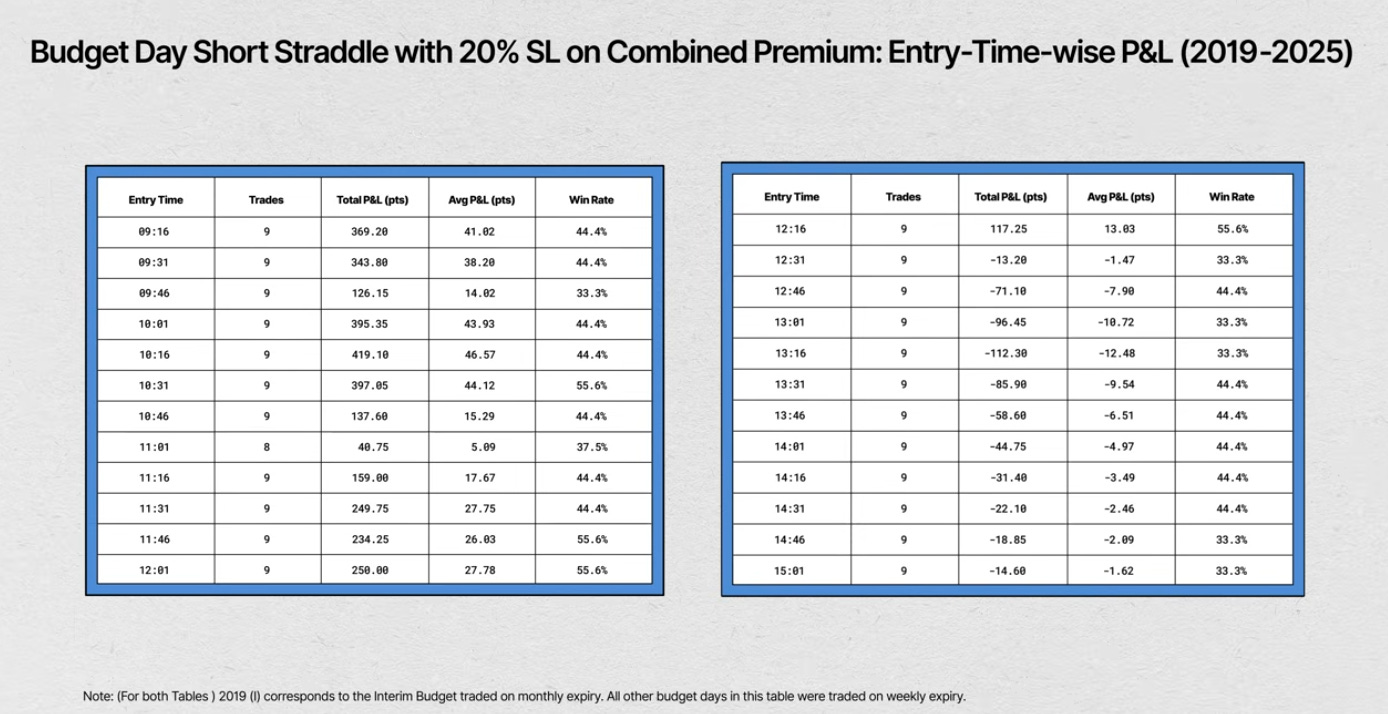
Under this stop-loss structure, the 10:30 to 12:15 window appears relatively better than other periods. However, when we step back and compare across approaches, the fixed leg-wise stop-loss setup performs more consistently overall.
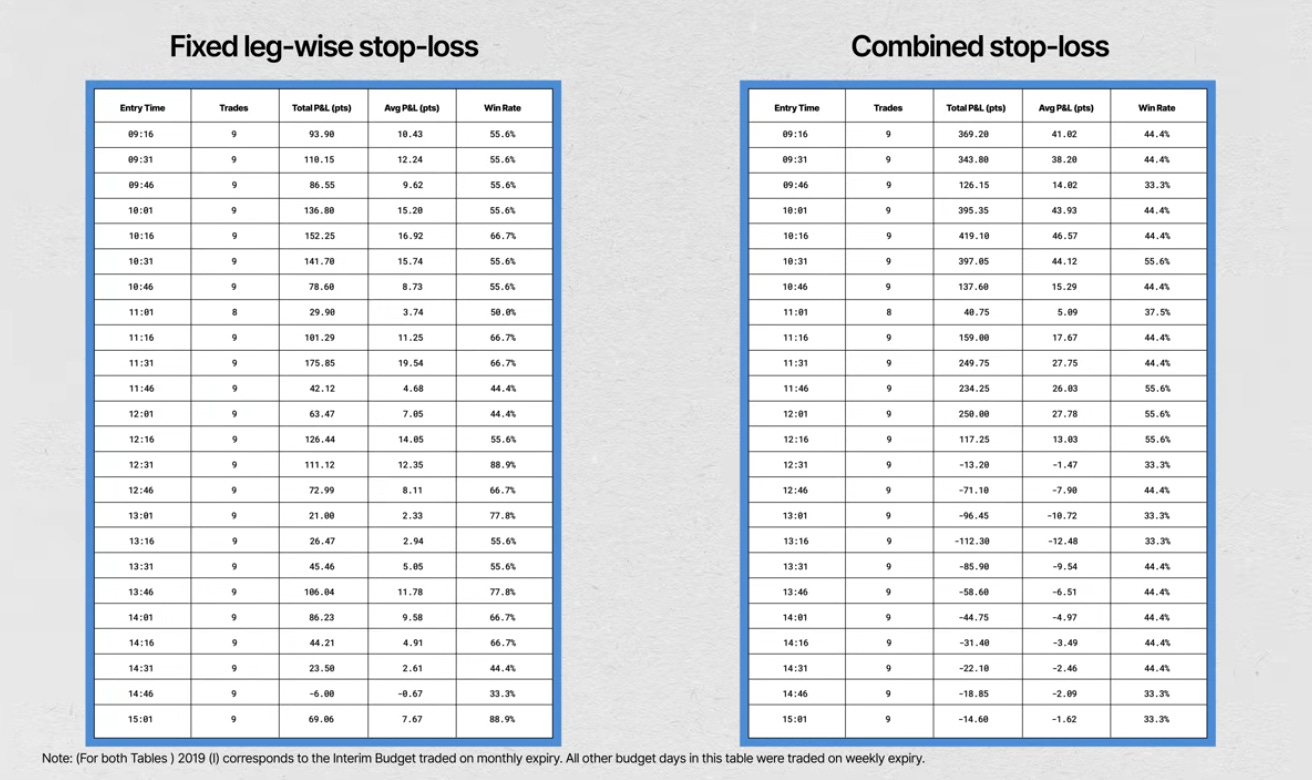
This suggests that a combined stop-loss may struggle to absorb intraday volatility on Budget day. As a result, it tends to exit trades more frequently compared to fixed stop-losses on individual legs, especially during sharp, two-sided price moves.
What About Long Straddles?
Some of you might wonder—why not try a long straddle instead? That was tested as well, and the results are consistently poor.
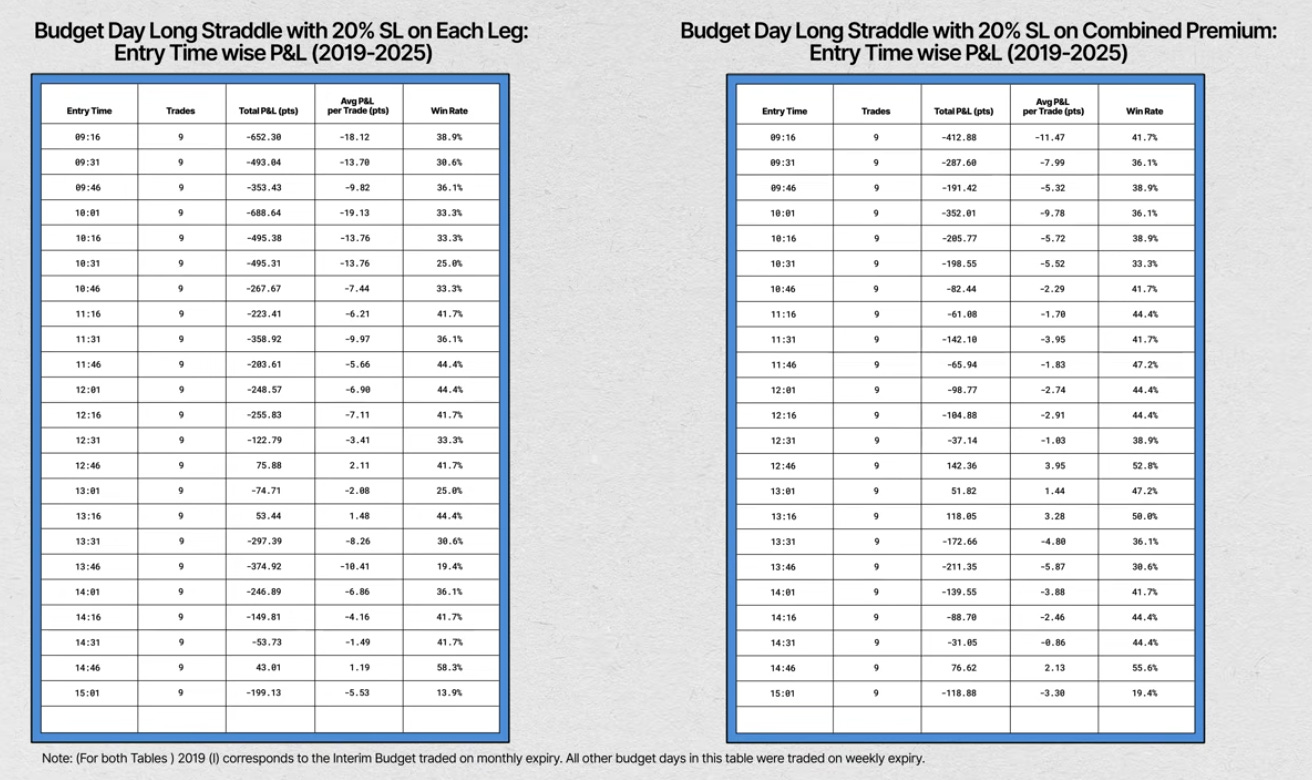
Here’s both Fixed Stop Loss Long Straddle with a 20% SL on both legs, and then a combined stop loss long straddle with a 20% SL. With the exception of an outlier around the 14:45 window on fixed stop loss and the 13:00 pm window on Combined, almost all time windows show negative performance. In practical terms, this suggests that long straddles struggle across nearly every intraday entry point on Budget day.
This also aligns neatly with the theory. Budget day is typically characterised by a volatility crush once the event risk passes, and long straddles—which rely on sustained or expanding implied volatility—are structurally disadvantaged in that environment.
In Summary
If we look at index price action around Budget day, the calendar bias for both January and February has been mildly negative. That said, irrespective of index direction, the build-up into—and subsequent collapse of—India VIX around Budget day remains one of the most consistent features in the data.
Against that backdrop, short-volatility strategies generally make more sense and tend to offer better odds, provided trade timing and risk management are handled carefully. It’s not that long-volatility strategies have no edge at all—it’s just that they are harder to time and more difficult to extract consistent profits from.
By anchoring our approach to volatility behaviour and by being selective about intraday time windows, we can tilt the odds marginally in our favour.
One word of caution: statistically speaking, we are working with a small sample size here, so all that I shared should be taken with a good dose of skepticism.
And finally, this year, the 1st of February falls on a Sunday. If markets open, as they have in the past, only then this analysis holds. Let’s see.
I hope you found this analysis helpful. Do let me know in the comments if you have any questions—I will try my best to answer.
Until then, stay sane and trade safe.